🔋 STX: The Bitcoin Multiplier - Next Stops $0.845 & $1.0 🎯👽Hey traders, Professor here! 👋
Quick update on STX Stacks. This gem is moving in sync with Bitcoin but on steroids. 📈
Key Levels:
Current Support: $0.60 🛑
Next Targets: $0.845 & $1.07 🎯
Bought the dip after the 55-cent rejection and it's been a smooth ride. 🛒
Why STX?
It's a Bitcoin layer for smart contracts. 🤖
Enables DApps to use Bitcoin as an asset. 💎
Secured by 100% Bitcoin hash power. 🔒
In short, if Bitcoin is the king, STX is the knight in shining armor. 🤴🛡️
Keep an eye on this one, folks. High expectations here! 🌠
Happy trading! 🤑
Emojis:
🚀🎯👋📈🛑🛒🤖💎🔒🤴🛡️🌠🤑
One Love,
The FXPROFESSOR 💙
STXUSDT trade ideas

STX Has A very good Investment Opportunity Hi Everyone;
today we have one of the best risk to reward Investment opportunity
it is more than 860 times the risk and the chart is look very promising.
I expect breaking the previous bear market key point will clear the way to the final target

Stacks STXSTX, the cryptocurrency on the Stacks blockchain, is generating considerable excitement as it gears up for a potential surge to new highs.
With its unique focus on smart contracts anchored to the security of the Bitcoin network, STX has positioned itself as a compelling player in the crypto space.
As the project continues to develop and gain traction, there is growing anticipation among the community that STX is on the brink of reaching new milestones.
The integration of smart contracts on Bitcoin opens up a world of possibilities, and investors are closely watching for developments that could propel STX to new heights in the near future.

Possible slow in Momentum of STXWe have seen a major push in BINANCE:STXUSDT from the 0.43 area to the 1.139 where we just might see a resistance. Next area I'd be looking for a buy setup would be around the 0.719. Fingers crossed and eyes on the ball

STX will be flying soonWe have bullish structures on the chart and candles react well to demand. It is expected that if the candles reach the green box, we will see a good reaction.
I specified the target. This analysis will be violated if a daily candle closes below the demand range.
For risk management, please don't forget stop loss and capital management
Comment if you have any questions
Thank You

STX/USDT Upward Momentum? 💫Stacks Today analysis💎 Paradisers, direct your attention to #STXUSDT as it showcases a compelling pattern. Currently trading within a consistent range, the asset exhibits a high probability of a bullish breakout.
💎 In the past, #STACKS has demonstrated a trend of following a descending trendline, breaking above it to initiate an upward movement. It has been faithfully adhering to a range-bound trajectory, experiencing rejections twice at the same resistance level.
💎 Presently, it's regaining bullish momentum, pointing towards a substantial chance for a bullish movement. Should this upward trend persist, It is poised to target the resistance at $.7380, and may even surge higher to challenge elevated resistance levels at $.8874.
💎 For #STX traders, readiness for a possible bullish rebound from the support level of $.5678 is crucial. However, be mindful that a drop below this level could signal challenges in maintaining the bullish trend.
💎 In this ever-shifting and dynamic market environment, strategic foresight and adept decision-making are key. Formulating a comprehensive trading strategy, which includes robust money management and a profound understanding of support and resistance levels, is essential for attaining successful trading outcomes. 🌴💰

STX/USDT Break out the Bullish pattern. Continue Bullish ??💎 STX is currently a significant focus in the trading community. In a similar vein to MINA, it's breaking out of a Bullish FLAG pattern and is entering a retesting phase at the resistance trendline.
💎 If STX successfully retests, characterized by a bounce off the resistance trendline, it could signal a continuation of its upward trajectory, probability aiming for a strong supply area in our target zone.
💎 However, if STX fails to rebound from the resistance trendline of the Bullish flag and instead consolidates around this level, it could be a troubling indicator. Such a scenario might lead to STX breaking down below the trendline. A breakdown like this would confirm a false breakout, potentially setting STX on a path back to a lower demand level around $0.592.

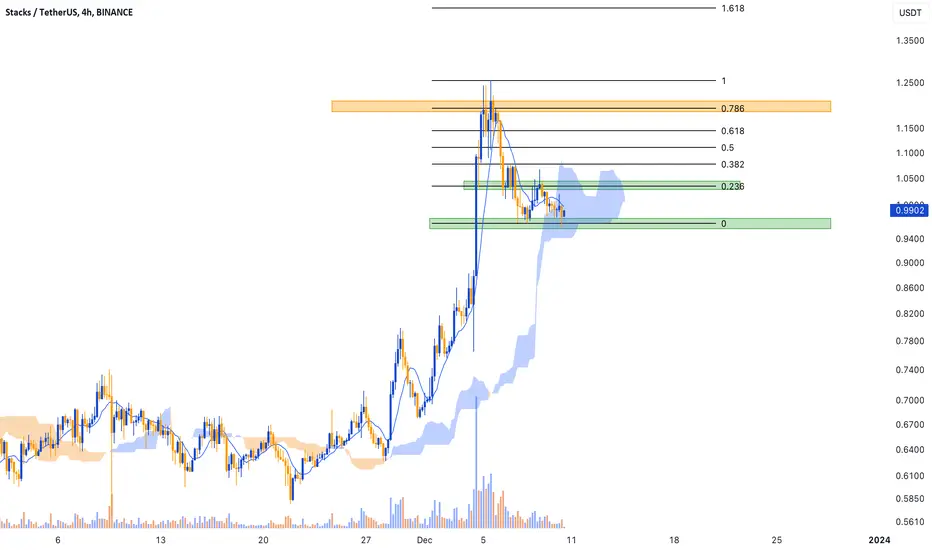
Critical Fibonacci LevelsSTX has experienced a substantial resistance at the crucial $1.1940 level, leading to a decline below the pivotal support zone of $0.9670.
Currently, the price is oscillating between the 0 and 0.236 Fibonacci retracement levels on the four-hour chart. This positioning suggests that the price is in the initial phase of retracement from its recent peak.
The area between these levels often acts as a key zone for potential reversals or continuation of the trend. If the price manages to breach this zone and sustains above it, it could indicate a shift in market sentiment, potentially leading to an uptrend.
Conversely, failure to break above the 0.236 level might result in a continuation of the downtrend.
This analysis is for informational purposes only and should not be considered as financial advice.

Stx next to breakoutGave you wld with a good entry and still in profit on 2.6
Now it's stx time to do breakout my stx target is 1.5
Good luck

#STXUSDT#STX
is forming a falling wedge pattern on the daily timeframe. If the price breaks out of the wedge, we can expect a bullish rally of 300%.

STX (Stacks) Plan ahead and a coin descriptionHello Folks!
I hope your day is profitable and stress free as that is the way we teach to trade!
Today we are looking at BINANCE:STXUSDT or the coin other wise known as Stacks. Taking a peek at this chart in a simple way. It is obvious that Stacks has broken from a huge falling wedge to form a continuation pattern of a bull flag and just keeps on going!
I have put some targets on this chart and made it easy for you to point out areas of resistance. Once you see the RSI becoming diverged in a bearish way at a target or a resistance take some profits and add them back during the pullbacks. This will add to your coin count when that final target is hit. Which is likely higher than the highest target we currently have on this chart!
Please let me know your thoughts in the comments and feel free to request a chart in the comments as well.
Here is some information on this coin to further your research in this investment.
What is STX Crypto?
BINANCE:STXUSDT
Stacks STX crypto coin
STX (Stacks) is a cryptocurrency project that aims to bring smart contracts and decentralized applications (dApps) to the Bitcoin network. It does this by creating a "second layer" on top of Bitcoin, which allows developers to build applications that leverage Bitcoin's security and immutability.
Here are some key features of STX:
Smart contracts: STX enables developers to create smart contracts on the Bitcoin network. This allows for the creation of a wide range of applications, including decentralized finance (DeFi), non-fungible tokens (NFTs), and more.
Decentralized applications (dApps): STX also allows developers to build dApps that run on the Bitcoin network. These dApps can be anything from simple games to complex financial applications.
Security: STX inherits the security of the Bitcoin network. This means that STX applications are highly resistant to fraud and censorship.
Scalability: STX is designed to be scalable. This means that it can handle a large number of transactions without becoming congested.
Some of the benefits of using STX include:
Access to Bitcoin's security and immutability: This makes STX applications highly resistant to fraud and censorship.
Ability to build a wide range of applications: STX can be used to build a variety of applications, including DeFi, NFTs, and more.
Scalability: STX is designed to be scalable, so it can handle a large number of transactions without becoming congested.
Here are some of the potential risks associated with STX:
Volatility: The price of STX is volatile, which means that it can fluctuate significantly in value.
Regulation: The regulatory landscape for cryptocurrencies is still evolving, and it is possible that STX could be subject to regulation in the future.
Competition: STX faces competition from other smart contract platforms, such as Ethereum.
Overall, STX is a promising project with the potential to bring smart contracts and dApps to the Bitcoin network. However, it is important to be aware of the risks involved before investing in STX.
Here are some additional resources that you may find helpful:
Stacks website: www.stacks.co
Stacks whitepaper: gaia.blockstack.org
CoinMarketCap: coinmarketcap.com
Coinbase: www.coinbase.com
Recent News about STX Crypto (as of December 9, 2023):
Price Rise:
STX has seen a significant price increase in recent times. Over the past 7 days, the price has risen by 32.66%, with a 4.66% increase in the last 24 hours. The current price sits at $1.02 per STX, still significantly below its all-time high of $3.61.
Potential Reasons for the Price Rise:
Anticipation of the Stacks 2.0 mainnet launch: This launch is expected to bring significant improvements to the STX network, including faster transaction speeds and lower fees.
Increased interest in DeFi and NFTs: STX's ability to enable DeFi and NFTs on the Bitcoin network is attracting attention from investors.
Overall positive sentiment in the crypto market: The recent rise in Bitcoin's price may have also contributed to the positive sentiment surrounding STX.
Other Recent News:
CoinMarketCap now lists the STX circulating supply: This will provide investors with a more accurate picture of the total number of STX tokens in circulation.
Stacks launches a new website: The new website provides a more user-friendly experience and includes information about the Stacks ecosystem.
Stacks announces a partnership with Hiro Wallet: This partnership will make it easier for users to store and manage their STX tokens.
Overall, the recent news surrounding STX is positive, and there is a lot of excitement about the future of the project. However, as with any investment, it is important to do your own research before investing in STX.
Here are some resources where you can find more recent information about STX:
Cointelegraph: cointelegraph.com
CoinDesk: www.coinbase.com
Stacks Twitter: twitter.com
Stacks Telegram: telegramguide.com
I hope this information is helpful. Please let me know if you have any other questions in the comments.

STX ANALYSIS🔮 #STX Analysis 💰💰
🌟🚀 There is a complete formation of Cup and Handle Pattern in #STX. We are just waiting for a perfect breakout. If #STX breakout with good volume then we will see a very good bullish move.🚀🚀
🔖 Current Price: $1.1628
⏳️ Target Price: $2.3400
⁉️ What to do?
- We have marked some crucial levels in the chart. We can trade according to the chart and make some profits in #STX. 🚀💸
🏷Remember, the crypto market is dynamic in nature and changes rapidly, so always use stop loss and take proper knowledge before investments.
#STX #Cryptocurrency #DYOR

STX, hot shill?I found a lot of KOLs shilling this coin STX
On 3D view, it's very nice triangle. Eyes on breakout, we need more volume. That's why a lot of shill LOL.
From my side, I will buy some spot. It can retest its main support at 0.44 - 0.47 and then explore to the moon!!!
Moon it! Enjoy.
Follow me for more chart analysis.
Patience is the key to success
DYOR

My next stx targetLong stx
With dca
First tp is 1.5 and then 2
It's a bull market take more and more advantage👍👏💪

Mock Up Price Action for STX | Mid Term (12HR)Mock Up Price Action for STX | Mid Term (12HR)
- Watching and waiting for opportunity to enter short

$STX stacks in another falling channel!!NASDAQ:STX Stacks in another falling Channel.
Previous falling channel found a bottom at 0.43 and then price action broke the channel to hit a height of 0.88 before retracing.
Current channel likely to find a bottom close to previous bottom around 0.43 before price action breaks channel to find resistances at: 0.6, 0.67, 0.75, 0.82, 0.88
#stx stacks current price: 0.51

#STX/USDT#STX
The price broke the descending triangle and has been falling since last March
With an oversold presence on the MACD
We expect an upward wave heading to 150% of the current price
Entry areas from
With a goal of 0.4000 to 0.5200
With a goal of 0.8900
We expect the price sequence to rise

STX 15mins Bearish OBSTX created beaeish OB above and ready to induced retail into shorting from the first OB but it will be a good idea to let the liquidity be grab towards the OB above the inefficiency......... Wait for entry and take a short from there
Follow for more market update and trade setup

STXUSDTFrom the data shown on the chart, there is wave 1 and wave 2. They have been completed and now it is preparing to launch into wave 3, which is to break the peak and retest it again, and all the data is shown on the chart.
Note: The analysis fails if the price closes below the bottom of wave two, area 0.4156

#STX/USDT - Long - Potential 27.45%Strategy: Long
Exchange: BINANCE
Account: Spot
Entry mode: Market order in range
Invest: 2.5%
Exit:
⎿ Target 2 : 0.9850
⎿ Target 1 : 0.8371
Entry: 0.7740
Stop: 0.6279
Big overhead resistance break.

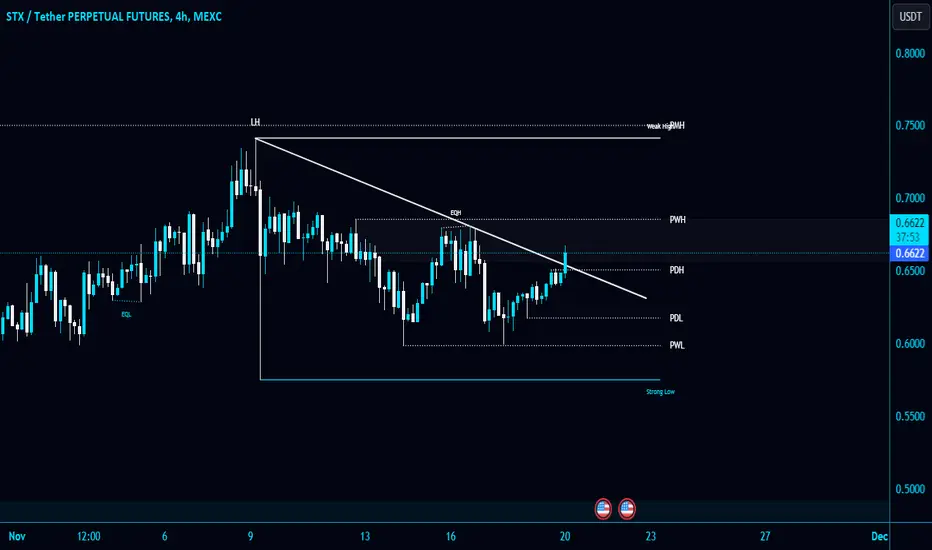
#STX/USDT breaks the Diagonal Trendline in 4-Hour TF!#STX/USDT breaks the Diagonal Trendline in 4-Hour TF!
Wait for successful retest in LTF to open a long position. NASDAQ:STX needs to clear PWH $0.6855 to gain the bullish momentum.
The local support level is PDL $0.6530.
The market needs a BTC layer like STXStacks is sitting in the healthiest re-accumulation range there is for 9 months now. Everyone that is in for so long is a believer. Ones we break out above a dollar, we aint stopping. We will slice trough the high like a knife trough butter.
People that dont see the need for STACKS have never used BTC to speculate in ordinals. If you actually used the BTC chain to do stuff you know what the problem is. Waiting 3 days for transaction confirmations and paying 100s of dollars of fees.
