StxusdtOne of the few coins on my watch list not to 'pumps so it probably will soon..
Probably for the next weekly candle
Btc fundamental coin offering decent yield last bull market if I recall correctly..
STXUSDT trade ideas

STX prepair to bull runThere are 3 touches on the resistance level + good volumes, I expect the landing of longists through the breakdown of the slope, then the opposite movement towards the root and its breakdown.

STXUSDT.P Prediction (2H, 1D, 1W charts)
This is a very bold prediction:
My prediction is that STXUSDT will reach the line of 0.8242 which showed multiple reactions in the past since February as shown in the screenshot above. The price is expected to reach its target by end of November.
It will make a V-shape like so.
If we take a look at the 2H chart to be more precise,
I expect the price to drop to approx. 0.6560 (black line in a screenshot above) where it would reach a minor support level and possibly bounce back up. This will be our entry price.
Our target will be 0.8242.


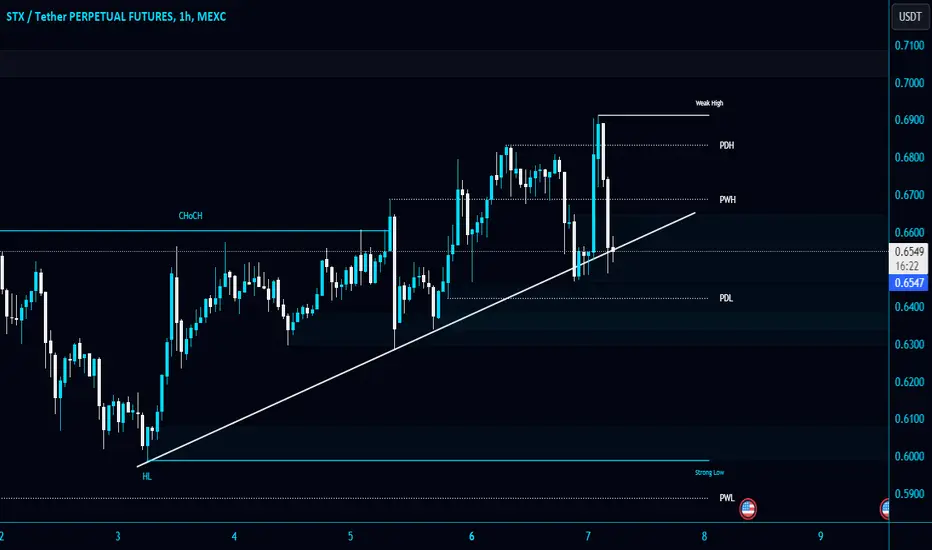
#STX/USDT is holding the Diagonal Trendline as a support in 1-Ho#STX/USDT is holding the Diagonal Trendline as a support in 1-Hour TF!
NASDAQ:STX needs to reclaim PWH $0.669 to turn bullish. Wait for $0.6485 breakdown to short it.

Not a fan of technical analysis butNot a fan of technical analysis but this weekly candle formation looks pretty ugly. A shooting start. Usually that signals the end of the local up move. Could easily get us back down to 50 cents.

STX is in time hell Hi, dear traders. how are you ? Today we have a viewpoint to BUY/SELL the STX symbol.
For risk management, please don't forget stop loss and capital management
When we reach the first target, save some profit and then change the stop to entry
Comment if you have any questions
Thank You

STX ascending channelSTX price moving up with this bullish momentum from BTC.
This triangle is coming to a decision point, with confluence from the RSI and bottom of the channel.

STX/USDT Downward Momentum ?? Stacks Analysis TodayYello Paradisers, Stacks Analysis: Navigating a Bearish Trend
💎 STX recently faced a rejection after hitting the supply zone, continuing its downward trajectory.
💎 Currently, it's approaching a demand zone where it could potentially bounce for a short upward leg before resuming its decline.
💎 In terms of the overall trend, STX remains bearish. Therefore, for those considering a short position, the Bullish Order Block (OB) area could serve as a potential target.
Entry Strategies:
💎 Short Position: Keep an eye on the Bullish OB area as a potential target for your short trade, given the prevailing bearish trend.
💎 Long Position: For a spot buy, either wait for STX to break and close above the resistance trendline or consider entering at the Bullish OB zone.
Choose your entry point based on these scenarios and the current trend.

Stacks STXUSDT Analysis: Breakout Point and ResistanceThe price action of BINANCE:STXUSDT (Stacks) presents an intriguing setup that resembles the Adam & Eve reversal pattern. Recent developments include a bullish breakout from a Falling Wedge pattern, suggesting potential upward momentum.
Key Target Levels:
Target 1: $0.53
Target 2: $0.57
Target 3: $0.59
Target 4: $0.64
Target 5: $0.68
Key Support Levels:
Support 1: $0.49
Support 2: $0.47
Support 3: $0.44
I anticipate a robust breakout with a possible pullback near the neckline before the next bullish swing.
Let's stay tuned! 🚀📊

STX looks bullishBy examining the waves, we can see that we are in a diametric that we are now ascending for the F wave of this diametric.
The green area is a good place to buy.
Do not enter a position without trading setup, stop setting, volume and leverage management

STX/USDT Ready to continue upward momentum ?? Stacks Analysis💎 STX has undeniably caught our attention. Presently, STX has achieved a breakout from the ascending pattern, marking a valid phase for retesting.
💎 STX now stands poised for further upward progression, evidenced by the robust green candle's rebound from the retesting phase at the previous supply-now-demand zone. The forthcoming target for STX is the supply zone, with a specific focus on surpassing the previous high at $0.595. There is a substantial likelihood of this scenario materializing.
💎 Conversely, a pessimistic development would be STX trending downwards, particularly closing beneath the demand level at $0.52. Such a movement would signify a bearish turn, as STX would re-enter the ascending pattern, potentially breaking through the supportive base of the ascent and closing lower.
💎 This outcome would be detrimental for STX, possibly triggering a continued descent towards a robust support zone, thereby indicating a shift in trend to bearish territory.

STX: Approaching ResistanceTrade setup : Following a bullish breakout from Descending Triangle pattern, price rallied 30% and reached our target of 200-Day moving average ($0.61). It is getting overbought (RSI > 70), so near-term, we could see some profit taking, which could be a swing entry opportunity. Stacks (STX) is a platform for scaling and building on top of Bitcoin.
Trend : Uptrend on Short- and Medium-Term basis and Downtrend on Long-Term basis.
Momentum is Bullish (MACD Line is above MACD Signal Line and RSI is above 55).
Support and Resistance : Nearest Support Zone is $0.43, then $0.30. The nearest Resistance Zone is $1.05, then $1.30.

STXUSDTsed on the given market data, it is observed that the STX coin is currently priced at $0.6096. The Relative Strength Index (RSI) for 4 hours, 1 day, and 7 days are 67.30, 78.01, and 53.87 respectively. The RSI values show that the coin is neither in the overbought nor in the oversold zone, indicating a balanced demand and supply scenario.
The Moving Average Convergence Divergence (MACD) for 4 hours and 1 day are positive (0.0253 and 0.0226 respectively), indicating a bullish trend. However, the 7 days MACD is negative (-0.0257), suggesting a potential bearish trend in the longer term.
The Bollinger Bands (Bb) for 4 hours, 1 day, and 7 days are 0.6360, 0.5800, and 0.7272 respectively, indicating a moderate price volatility.
The immediate support and resistance levels for 4 hours are $0.5656 and $0.6773 respectively. For 1 day, the support and resistance levels are $0.5223 and $0.6773 respectively. And for 7 days, the support and resistance levels are $0.3925 and $0.8250 respectively.
In conclusion, the STX coin seems to exhibit a bullish trend in the short term but a bearish trend in the longer term. Therefore, potential investors might want to consider these factors before making investment decisions. It is also recommended to keep an eye on market trends and other economic indicators as cryptocurrency prices can be highly volatile.

STX at daily and 4hrs TF resistance In our post about STX symmetric triangle, we let you know STX will pump hard if breakout and retest the symmetric triangle…. As we can see STX did good pump after breakout and retest.
But right now we need to listen to what the PA (Price Action) is saying as we are currently facing daily resistance and 4hrs TF resistance…. I’m expecting a little correction here to 4hrs support below as indicated in the chart…. Be safe
Follow for more market update and you can chart us for trade setup

STX 60 %+STX Possible move up 60 %+
After many weeks of corection, stx looks ready for pump, if BTC close 29000 + i whink we can see altcoins rally

symetrical triangle breakout (0.5% risk)triangle breakout, thinking btc upside resulting in STX as a beta play and has a triangle formation playing out

💡Trade Idea #STX/USDT:The price is trying to break this resistance level. Waiting for a breakout. #Bitcoin pumped so maybe we have a chance also on these blue-chip coins.

STX Symmetric triangleSTX forming symmetrical triangle on 4hrs TF… Wait for breakout from either of the side and take a long or short from there… Manage your risk as always
Follow for more market updates or chat me up if you want trade setup

STXUSDT Idea .....if STX drills thru the resistance line and stay above the previous Daily close, then we can head towards .8
This is Just an IDEA
NAFA n DYOR
ThankYou...

STXUSDT 1DFalling Wedge formation on daily chart. #STX is facing with resistance cluster (Falling wedge resistance + EMA100 + ichimoku cloud). Expecting breakout on this one. Targets are on chart.

