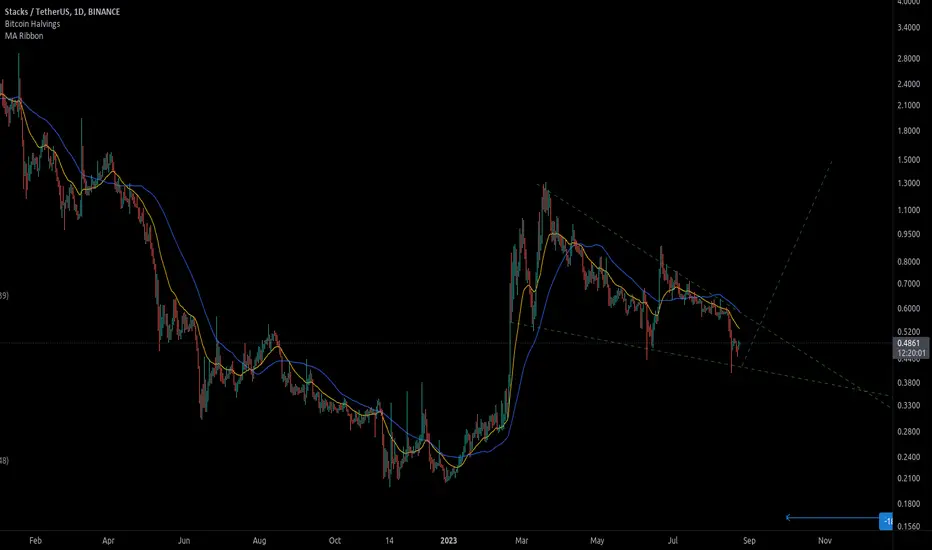
Stacks just broke outSTX just broke out of its weekly falling wedge and literally no one cares. I smell a pump to 70 - 90 cents the next month or two.
STXUSDT trade ideas

Located in an ambiguous areaHello?
Hello traders!
If you "Follow" us, you can always get new information quickly.
Please also click “Boost”.
Have a good day.
-------------------------------------
(STXUSDT.P chart)
(1D chart)
It has touched the 0.4704-0.4781 range and is rising, but it is currently judged to be in an awkward position to enter.
Accordingly, I think priority should be given to confirming support around the 0.4704-0.4781 range.
(1h chart)
It shows an upward trend, rising above the 0.4803-0.4923 range.
However, because a box section is formed in the 0.4985-0.5296 range, there is a possibility that the rise may be limited.
Accordingly, it is necessary to check which direction it deviates from the 0.4923-0.4985 range and check whether the movement continues.
However, since entering a SHORT position is considered more risky, I think it is better to wait and then enter a LONG position.
-------------------------------------------------- -------------------------------------------
** All explanations are for reference only and do not guarantee profit or loss in investment.
** Trading volume is displayed as a candle body based on 10EMA.
How to display (in order from darkest to darkest)
More than 3 times the trading volume of 10EMA > 2.5 times > 2.0 times > 1.25 times > Trading volume below 10EMA
** Even if you know other people’s know-how, it takes a considerable amount of time to make it your own.
** This chart was created using my know-how.
---------------------------------

#LQR #TOBTC #STXthese two senarios are existing for STX
You may follow the path about sell Triiger and also buy trigge
keep you'r money manangment and always DYOR

STX macro wedge coming to an endIll let you guess which way its going to break. Ill put a target on it. 1 dollar until the halving.

stxusdt-mentoringstxusdt speculative view
made a full retracement on weekly since begining of the year
trading at the lows and currently if holds its a HH
and now looks very good RR on weekly, still not confident
have to close above 59 to proove it
look for short if rejects from 4878
look for long if retrace from 3735
look for short if close under 4405
look for long if close above 5045
***
Tolerance will reach such a level that intelligent people will be banned from thinking so as not to offend the imbeciles- F.M.dostoyevsky

💡Trade Idea #STX/USDT:Looks interesting. Bullish if only it will be able to break this descending channel, but also there is a bearish pennant pattern or whatever, support is trying to hold #STX price at the moment. For sure we are in a downtrend so to look at short/sell is my priority.

STXUSD ❕ declineTrading volumes declined.
STX broke down 200EMA (30m TF)
I believe that the asset will continue to decline.

STXUSDT → Price over the wedge resistanceBINANCE:STXUSDT breaks resistance amid bitcoin consolidation. Earlier, a false breakout of consolidation support was formed, which influenced the trendline breakout
We see a prolonged consolidation formation in the format of a descending wedge. Yesterday, when BINANCE:BTCUSD began to strengthen on the background of weak positive news, Stack/TetherUS broke through the resistance of the figure. A day later, we see the price consolidation above the line and now, if the consolidation is successfully realized, the price may reach 0.5447 in the near future.
Regarding the indicated resistance - 0.5447. This line delimits us from a strong bullish growth. If the coin is able to break this resistance on a retest, then in the medium term we could see a rise to both 0.8779 and 1.1924
Support levels: 0.4371, trend line
Resistance levels: 0.5447
I expect growth to the resistance of the range with the subsequent breakout after a small pullback.
Regards R. Linda!

HOW-TO use Adaptive Sideways FilterMy ASF (Adaptive Sideways Filter) is a sophisticated indicator used to identify sideways markets. Its goal is to filter market noise and false signals, accurately identifying the sideways phase of the market.
ASF uses an intelligent method to determine sideways markets. It adjusts its parameters based on market volatility and trends to adapt to different market conditions. When market volatility is low, ASF reduces its sensitivity to avoid mistaking it for a sideways market. On the other hand, when there is high market volatility, ASF increases its sensitivity to capture market trends more effectively.
ASF calculates based on market price fluctuations and trends. It uses a series of Average True Range (ATR) values to measure market volatility and adjust its parameters accordingly. ASF also relies on an indicator called "Directional Index" to measure the trend of the market and adjust its parameters based on changes in the Directional Index.
By using this adaptive approach, ASF can provide more accurate signals for sideways markets under different conditions. It helps traders avoid trading during sideways periods, reducing ineffective trades and losses. At the same time, ASF can also help traders capture better trading opportunities when there are trending movements in the market.
However, please remember that ASF is just an indicator and cannot guarantee 100% accuracy or success. Traders still need to combine other technical analysis tools with their own trading strategies for comprehensive judgment and decision-making when using ASF.
Here's how you can use this indicator: The purpose of ASF is to identify horizontal price fluctuation cycles and plot them on charts. This tool is valuable for traders looking for range-trading opportunities. The code of this indicator was written by me using TradingView's proprietary programming language Pine Script version 5 which provides enhanced functionality and flexibility compared with previous versions like Pine Script 4 or lower versions like Pine Script 3 or below versions like Pine Script 2 or earlier versions like Pine Script 1 etc.. However, it is not supported by software like Tongda Xian, Thun Hua Shun etc. Many friends have messaged me saying that the code I posted doesn't work in Tongda Xian or Thun Hua Shun, which makes me feel frustrated. Well, all I can say is: The revolution has not yet succeeded; comrades still need to work hard.
Firstly, several user-defined input parameters are defined. These parameters include the moving average length used to calculate thresholds, the threshold value that determines the width of sideways ranges, and the smoothing length applied to source data. By adjusting these parameters, traders can fine-tune the sensitivity of the indicator to suit their own trading strategies. One key feature of this indicator is incorporating Average True Range (ATR) concept into it to determine the width of sideways ranges. ATR is a widely used technical indicator for measuring market volatility. By multiplying ATR values by a user-specified threshold, this indicator calculates upper and lower channels defining price sideways movements. This indicator is used on main charts and overlaps with closing prices while indicating upward movement with green coloration and downward movement with red coloration as well as sideways movement with blue coloration through line colors,K-line colors,and background colors.The chart's colors and K-lines dynamically change based on closing prices' relative positions compared with upper and lower channels.If price lies above upper channel,the color will be green indicating potential overbought condition.If price lies below lower channel,the color will be red indicating potential oversold condition.When price lies within channels,the color will be blue indicating sideways movement.In addition,this indicator provides visual cues through coloring K-lines and adding background colors further highlighting periods of horizontal price fluctuations.
By using ASF indicators,traders can gain valuable insights into market behavior and make wise trading decisions helping identify potential range-trading opportunitiesand adjust strategies accordingly.In summary,"Adaptive Sideways Filter"indicatoris a powerful tool understood by those who understand it,used to identify horizontal price fluctuations and discover potential range-trading opportunities.Through its customizable parameters,integrated average smoothing data,and utilization of ATR,this indicator provides traders with a comprehensive view of market dynamics,enabling them to make wiser trading decisions.
As I believe this value is very valuable for my personal trading system,it is currently released in the TradingView community and can be used for free,but the code is not open source. Anyway, as a code blogger,I will still explain the logic of this indicator. Friends with sufficient comprehension can create it themselves.
One key feature of this indicator is integrating smoothed Heikin-Ashi (HA) candlestick chart data.The code includes a function called "heikinashi_tv" which generates smoothed OHLC (Open, High, Low, Close) data from traditional candlestick chart data.Smoothed charts reduce market noise and provide clearer views of price trends.By combining smoothed data,the ASF indicator aims to improve stability and accuracy in its analysis.
The code also includes a function called "cumavg" to calculate the cumulative average of given source data over a specified length. This function is used to calculate the source data for the indicator.
The main logic implemented by this indicator is as follows:
1. Use the "heikinashi_tv" function to generate smoothed OHLC data from traditional candlestick chart data. This ensures that the indicator is more stable under smoothed data.
2. Apply the "cumavg" function to the smoothed closing price with the specified smoothing length to calculate the source data.
3. Calculate Average True Range (ATR) based on the specified length.
4. Calculate upper and lower bands by adding and subtracting threshold multiplied by ATR value from moving average line of source data.
5. Determine colors for plotting and histogram based on position of closing price relative to upper and lower bands. If price is above upper band, color is green indicating potential overbought condition; if price is below lower band, color is red indicating potential oversold condition; if price moves between bands, color is blue indicating sideways movement.
6. Dynamically plot closing prices on chart using line style.
7. Color K-line based on same color scheme.
8. Add background color to further highlight periods of sideways movement in prices

STX risk reward is insaneCurrently sitting at 640 M market cap this project is dirt cheap. I cant see a valid reason why it cant reach 50 billion market cap in the bull market. Remember how Cardano got to 100 Billion without smart contracts enabled? STX fixes Bitcoins glaring issues of scalability and program-ability which became even more glaring after ordinals were invented.
Also it is an easy to analyze play. You dont need to have some special skills that only a hand full of high tech geeks understand. The story is simple to figure out and the price targets are easy to imagine. What do i mean by that? Can you tell me what is the potential market cap of GRT? Or Fil coin? or a random meta verse coin? They sound important, but i doubt very many people know how big these markets can get.
Stx market size calculation is easy. If BTC goes to 2 trillion and STX captures 5% of it the potential is 100 Billion. That is 150x from current price.

stxusdtHello Traders,
As we can see that after a good potensial pump we can expect a good dump from here, you can open a short position from here.

✴️ Stacks | The Early Days...It is all in the chart drawing.
For this one we will focus only on a few points.
1) Resistance turned support.
This is the blue line. When resistance turns into support new impulses can develop once this level is activated.
As the support level is tested and holds, this can lead to a new bullish wave.
2) Volume breakout.
Rising volume as a strong breakout takes place can support change.
If the market has been in correction mode, the strong bullish sessions in the last two days coupled with high volume can tell us that this correction is over and the initial bullish trend can resume.
*) Bonus
The RSI is bullish near support.
3) Potential targets
I am still a bit undecided on this one about the final target, it is too early for me and it seems we are entering unexplored territory.
Cryptocurrency is the present and future of money, the traditional financial systems and other outdated control systems are breaking down... We are living this lifetime once even though we live many times, the specific conditions now manifested are certainly unique to our time.
Sorry, I am digressing. I am not so sure about the next high but $1.30 seems easy/certain and $1.78 as a new high is possible... We will wait and see but I am starting to get early signals as if a major development on the positive side for Cryptocurrency will happen this month; the whole game can change.
Think years in the past, we saw many pairs growing 10, 20, 30, 40, 50X.
Instead of 2-5X for the entire bull-market, we get a repeat of the early days.
So short-term we can see strong waves and when we add everything up, total growth can be insane.
If you are reading, you are a winner.
Right now just being around is more than enough...
Namaste.

STX is a great opportunity for investorsSTX is solving an extremely valuable problem for BTC. Aka scalability and program-ability. For some reason the market isn't valuing the solution yet which provides a great opportunity for me and you. Again its a very easy calculation. If BTC goes to 2Trillion this cycle and STX captures 5% of BTCs market cap that is 100B. From current price that is 140x opportunity. Will it fulfill its full potential? Who knows. Lets say that im wrong and it does 1/3 of that its still a 43x.
STX STILL IN AN INVERSE HEAD AND SHOULDER PATTERNNASDAQ:STX STILL in an inverse head and shoulder pattern with right shoulder still forming.
Neckline resistance: 0.79 - 0.81
A breach of neckline resistance will lead to higher prices: $1, 1.21, 1.31
Else #stx will retest previous support at 0.43
@Stacks Current price: 0.63

BTC application layer will be on StacksStacks at this market cap is ridiculous. I believe that the real value will be recognized in the bull.
BTCs store of value layer is currently sitting at 550B and the its application layer which i believe will be on stacks is in its infancy.
This cycle everyone expects BTC to under-perform ETH in the bull because it did it last cycle, but im not so sure it will this time. New value is being unlocked right now with BRC-20s and the application player of BTC, aka STX.
If builders keep building on BTC as i have witnessed they do this year, a new BTC ecosystem will be created. No one knows what it could be worth at the top of the BULL. Just for giggles lets assume that BTC 4x from here. That is over 2 trillion MC. Lets assume that Stacks captures 5% of that value it could be sitting at 100B market cap. That is 125x from current price.
And im not talking about a new coin that just came out. This is a large cap that already survived one cycle so the risk of going to 0 is way lower then a normal 100x play.

STX 🔋👽 -Charged for 0.77 Or Higher?STX IS OINE OF MY FAVORITES..YOU HEARD BEFORE:
One of my favorites and a reliable choice for a very good 3 successful trades.
If you are not aware of what STACKS is you should def look into it as it has immense potential going forward.
STX is a Bitcoin layer for smart contracts
What Is Stacks (STX)?
Stacks is a Bitcoin Layer for smart contracts; it enables smart contracts and decentralized applications to use Bitcoin as an asset and settle transactions on the Bitcoin blockchain.
Bitcoin is the largest, most valuable, and most durable decentralized asset. The Stacks layer unlocks $500B in BTC capital using the Bitcoin L1 as settlement for decentralized applications.
Stacks has knowledge of the full Bitcoin state, thanks to its Proof of Transfer consensus and Clarity language, enabling it to read from Bitcoin at any time.
All transactions on the Stacks layer are automatically hashed and settled on the Bitcoin L1. Stacks blocks are secured by 100% Bitcoin hashpower. In order to re-order Stacks blocks/transactions, an attacker would have to reorg Bitcoin.
My spot holding have grown from 20 cents to almost x5 and the leveraged trades went even better...
Only Bullish on this one as i see 10-18 range for the next 2 years.
One Love,
The FXPROFESSOR
Links: Ordinals and STX Among Projected Beneficiaries of BlackRock ETF coinedition.com

#STX/USDT - Long - Potential 7.47%Direction: Long
Market: Spot
Risk: 0.25% - 1%
#USDT_STX
Exchange: BINANCE
Timeframe: 360
TP1: 0.6604
Entry: 0.6197
STOP: 0.579
Entry Conditions:
| Falling wedge break
| 20MA break
| RVD break

STXUSDT BUY TRADE SETUPStx usdt completed wave 5 and is just came out demand zone waiting for Impulse wave 33% growth potential from here .... This is not Financial advise.

#STX USDTWhat Is Stacks (STX)?
Stacks is a Bitcoin Layer for smart contracts; it enables smart contracts and decentralized applications to use Bitcoin as an asset and settle transactions on the Bitcoin blockchain.
Bitcoin is the largest, most valuable, and most durable decentralized asset. The Stacks layer unlocks $500B in BTC capital using the Bitcoin L1 as settlement for decentralized applications.
Stacks has knowledge of the full Bitcoin state, thanks to its Proof of Transfer consensus and Clarity language, enabling it to read from Bitcoin at any time.
All transactions on the Stacks layer are automatically hashed and settled on the Bitcoin L1. Stacks blocks are secured by 100% Bitcoin hashpower. In order to re-order Stacks blocks/transactions, an attacker would have to reorg Bitcoin.

Stacks is the best risk reward coin i can findFirst of all BTC is the biggest, most well known crypto coin with the most liquidity. At the same time it has the biggest scalability and programability problems. In the bull market you can literally wait for days for your BTC to transfer. Not to mention it is not programmable.
Not to worry. Here comes STACKS. One of the few layer 2 solutions on BTC which also has smart contracts. Currently valued at under a billion market cap, which is ridiculous. If STX was to capture only 10% of BTC MC currently it needs to be sitting at 60x from where it is now.
What happens in the bull market when BTC goes to 3 trillion MC? Stacks can be up to 300 billion MC.
Ill let you do the math of how much potential this coin has. I would say that 50 dollars is a very conservative target for this coin.

✴️ Stacks Targets (125% to 175% Potential Mapped)This is done at your request, you wanted an update but the chart is the same and it is clear.
I've been updating the old trade idea but... Here you have it.
I hope you find this information useful and it answers your question.
STXUSDT (Stacks)
We have the initial breakout after the 10-June low.
This leads to a correction that ends 10-July.
Now we have four days green with a clear bullish bias based on the recent short-term higher low, the strong indicators, etc.
Everything is pointing up and the market moves together as a whole.
This is just as we predicted.
Enjoy the profits as they come.
The targets on the chart.
Wishing you great luck, health, wealth and success.
You deserve the best, now and always... Remember that.
Namaste.

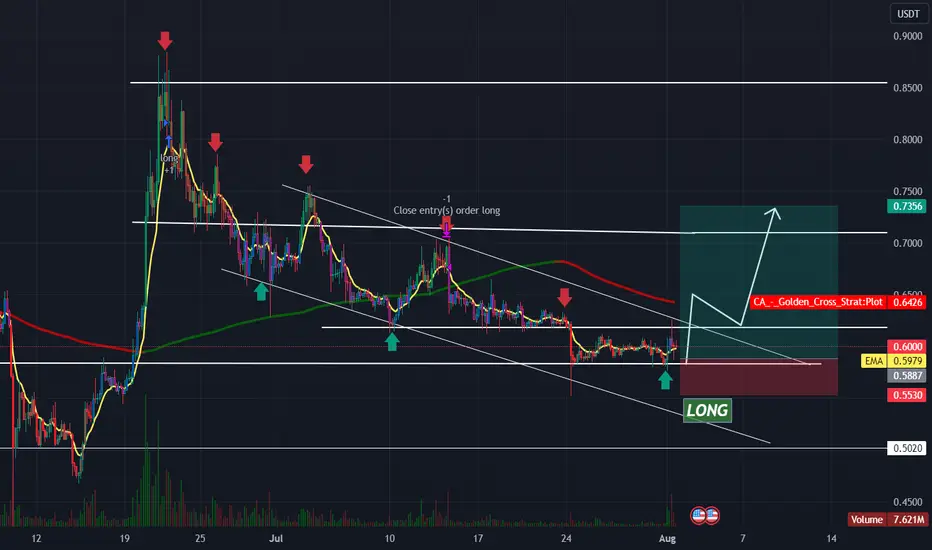
STXUSDTHello TRADERS,
As we can see from the chart of STX we can expect a bullish move from here up to the upper resistance, hold it tight we can expect a pump from here.
STX MOVE STX broke a downward trend also broke a horizontal resistance. A healthy retest is happening.
Stop loss: 0.6030
Targets shown in the chart
