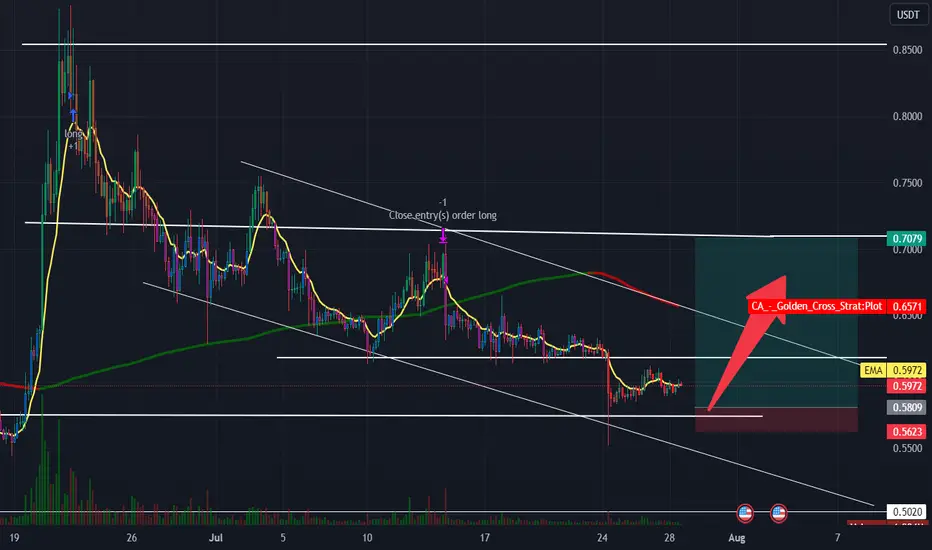
Stx Breakout Stx did a great breakout and will Long on retest. Aslo there is fib golden zone at retest Entry zone.
STXUSDT trade ideas

STMXUSDTwe can see clearly that stmx is moving in a falling wedge, but it is now down the support and now we can expect a move up to upper resistance.
Profitable at least 20% for next bullishDaily chart
Stacks ( BINANCE:STXUSDT ) has soared very strong and closed at 0.8829 before it's dropped
Now, it's trading around 0.6337 and I think I accumulating quite long time and next move will happen soon
You can see a triangle pattern on the chart with profitable at least 20% if Stacks breaks out
Wait for next move
I'll update


#STX LONGSTX having a strong support on the resistance soon we can see a big move around 20%, if you are holding #STX keep hold soon it will pump. Cheers!

Stacks bullish outlook in focus?👀!! 🚀STX Today Analysis💎A breakout of a descending channel to the upside, and is currently trading above the Point of Control POC of the Volume Profile Visible Range.
💎This POC is acting as a support level, indicating high volume and signaling bullish momentum.
💎There's a possibility that STX might pull back to retest the trendline of the channel before moving upwards - both scenarios are on the table.
💎Additionally, STX is currently in a high demand area, further confirming the bullish outlook.
💎In the dynamic world of crypto, staying informed and adaptable is key. Stay tuned for more updates and enjoy your trading journey!

stx rocket lunchWe notice the bearish trend line has been broken
And the entry of liquidity into the market
It is not a requirement for a correction of the entry area, it may rise from the current price
I apologize that my English is not good
Good luck to all
target
in chart
stop lose
in chart
Did you like my analysis? Leave a comment, like, and follow to get more

STX/USDT Analysis: Potential Reversal in SightGreetings, traders! Let's dive into the STX/USDT pair and examine its current chart patterns. On the one-hour chart, we can observe promising signs of a potential reversal.
Presently, STX/USDT is within a falling wedge formation, which often suggests a higher likelihood of breaking to the upside. Adding to this optimistic outlook, the formation of a double bottom within the wedge provides further support for an upward move.
However, it's important to be cautious as some technical indicators are sending mixed signals. The RSI, MACD, and Stochastic RSI are hinting at the possibility of further downside, which could potentially form a triple bottom pattern.
To ensure better entry points, it would be prudent to closely monitor the price action over the next few hours. This will allow us to gather more information and assess the strength of the potential reversal.
I encourage you all to share your thoughts on this analysis. If you agree or disagree with any part of it, please feel free to comment and engage in the discussion.
As always, remember to exercise proper risk management and stay vigilant during your trading journey. Happy trading, and let's see how this exciting setup unfolds!


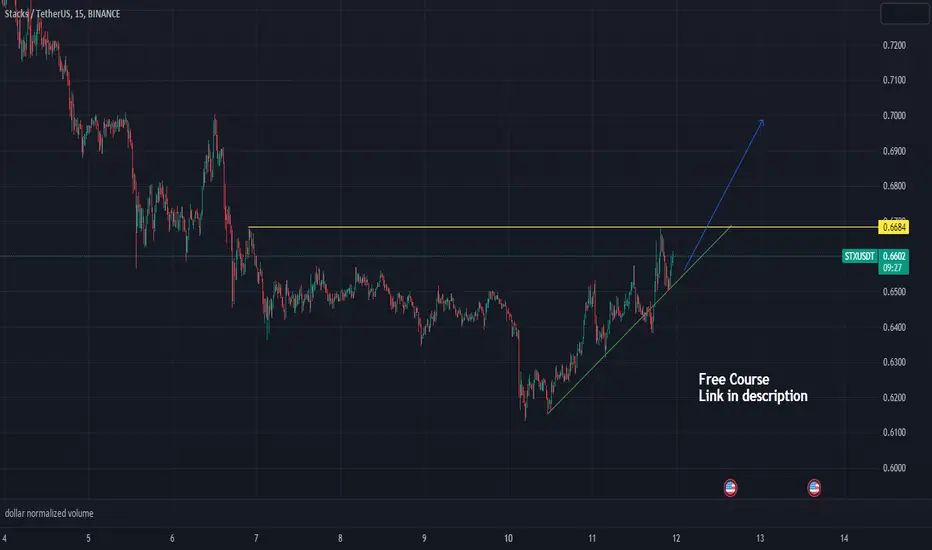
STXUSDT LongWe have strong bullish signal on stacks daily TF, Risk reward is 1/3 , This signal is confirmed with 3 and more trusted strategies...

STXUSDT Long/Shorttested .622
Now time to fly n EAT 1$
nafa
dyor
IT WILL GIVE U GAINzzzzzz
LET US ROCKET

STXUSDTlooks like a similar structure to alot of coins thatbroke out on the last move
30% from here to target if the ihs plays like in other similar coins
ldo arb are the similarstructured charts

✴️ Stacks UpdateThis is the same chart I shared 7-June on purpose. Notice how prices moved below the stop-loss/support just to recover even faster, within a day with high volume and a bullish engulfing candlestick pattern.
The RSI is strong and supported by rising volume. When such shakeout moves take place, this is a strong bullish signal. The only reason for big market players, whales/exchanges and market manipulators to produce these shakeout moves is because everything is about to grow.
So they want to shakeout "weak hands"... Are you in it for real or do you have doubts?
If you have doubts you sell and quit, if you are certain you buy more and/or hold.
Now that the shakeout is complete, the markets can grow.
There can be more volatility and additional shakeouts, keep this in mind... No surprise, trading cryptocurrencies is tricky, the market is new and more advanced than the old ones.
We have to be smart and be prepared.
Diversify and plan ahead.
I am wishing you tons of profits, great luck, wealth, health and abundance.
I love you now and always.
Thanks a lot for your amazing support.
Namaste.

STX has good level to breakAfter the price came to the global support zone, a locally uptrend began.
We are seeing increasing volumes and the price striving for the nearest resistance zone, where we can already fix some positions, which may indicate the continuation of the locally uptrend.
STXUSD ❕ upper boundary of the channelTrading volumes decreased on price correction.
RSI is around neutral values.
On 1H TF the asset has fixed above 50EMA.
The price will continue to rise after exiting the channel.

$stx retest successful We should target our first resistance at .7, closing 1 hour above that price could take us to 0.7252

STX/USDTThe price has managed to break its bearish corrective trend line.
So, in my opinion, the best area to enter the trade is the green demand area, which overlaps with the blue price action area.


StxusdtLow time frame scalp idea big % for ltf
Tight stops just below trendline
Break back into range here?

StxusdtThink we see something like this for July tbh
Crazy high volume
L.s.d narrative
In a small bullish cork
Above supertrend retesting
Double tap the .618?

STX - Stacks I believe in YouThe increase in Stacks explained:
It’s unusual for a cryptocurrency to announce a 2x return in this down market. However, Stacks (STX) was able to do this in June because to a few fortunate circumstances. Although the smart contract platform and Bitcoin (BTC) are closely related, many customers consider Stacks to be a better option for their wallet.
While waiting, you can wonder where to invest your money to make a similar or even better purchase. A different funding platform, VC Spectra (SPCT), which is expected to experience an exceptional 10x rise, may provide a workable solution for early blockchain and technology start-ups.
Since its inception at the beginning of 2021, Stacks (STX) has given Bitcoin a new layer of usage, riding the wave of rekindled interest. The price of STX is growing as a result of several fundamental Bitcoin-related events. The main one is BlackRock’s decision to submit an exchange-traded fund for Bitcoin.
Curiously, it is with the SEC, the same regulatory body that is engaged in legal conflict with Coinbase, who may serve as the ETF’s custodian. However, there is a lot of institutional interest in Bitcoin (BTC), which has benefited Stacks (STX).
Other commentators have said that Bitcoin has an advantage over other currencies since the SEC views it as a commodity rather than a security. Additionally, that is advantageous for the Stacks blockchain.
Stacks have increased by more than a factor of two from $0.43 to $0.88 since June 10th, 2023. In actuality, this doesn’t mean Stacks (STX) is safe. But if this trend keeps up, Stacks could eventually reach its $1.50 goal by 2023.
Chart:
I see 1.07 as the key all time trend line S/R level.
Price will most likely do go there for a check..if that level fails price will come lower but i still see most likely the breakout happening which unlocks 2-7$.
Ultimately i see STACKS in the 10-19$ range in 2025-2026
One Love,
The FXPROFESSOR

STX - only SEC registered crypto & Bitcoin Smart ContractsI am loading up on STX mainly because it is the only SEC registered crypto project out there.
Also Stacks allow users to deploy smart contracts on Bitcoin Blockchain - you might have heard Ordinals recently, NFTS on Bitcoin. There arent many other strong candidates with such fundamentals.
It has already broken out of the down trend, and seems like finding support above a major resistance.

STX: Navigating the Ups and DownsStacks (STX), a pivotal token in the blockchain ecosystem, has been charting an interesting course. A coin integral to the functioning of the decentralized apps and smart contracts on the Bitcoin network, STX has been showing signs of volatility, encouraging traders and investors to examine its performance closely.
Snapshot: Current Market Scenario
As of our analysis, the price of Stacks is at 0.7078, representing a drop of approximately 4% over the past 24 hours. This indicates a recent bearish sentiment in the market. However, as seasoned traders would affirm, the tide in the crypto market can turn swiftly, and current bearish trends do not rule out a potential bull run in the near future.
The Short-term Picture: 1 Hour Time Frame Analysis
On the one-hour chart, we observe an RSI value at 40, a level typically regarded as the brink of the oversold territory. This suggests that we might expect a potential price reversal or at least a pullback in the near future. Confirming this speculation is the MACD reading of -0.0068, which could indicate a shift in the market momentum towards the upside.
The Fibonacci Retracement, a tool used by traders to identify potential levels of support and resistance, shows 0.6988 as the 0 level, 0.7480 as the half level, and 0.7871 as the first level. These levels could play a significant role in the future price movement of STX. A volume oscillator at -18% suggests that trading volume has decreased, a trend often preceding a significant price movement.
Mid-Term Prospects: 4 Hour Time Frame Analysis
Zooming out to the four-hour time frame provides us a wider perspective. The RSI and MACD continue to indicate a potential bullish reversal, reaffirming the readings from the one-hour chart. The Fibonacci Retracement levels for this time frame are 0.7111 (0 level), 0.797 (half level), and 0.8829 (first level). An increase in trading volume may be required for the price to reach these levels.
The Long Game: Daily Time Frame Analysis
On the daily time frame, the indicators paint a slightly different picture. The RSI is sitting at a neutral 56, the MACD at 0.0358, and the stochastic is at 57, all hovering around the middle of their respective ranges. This neutrality suggests an equilibrium between buying and selling pressure, and we might be in for a period of consolidation.
Fibonacci levels are also of interest, with 0.8829 as the 0 level, 0.66 as the half level, and 0.4371 as the first level. These will likely be the critical levels to watch out for in the near to mid-term.
Wrapping Up
To sum up, despite the recent downward movement, the technical indicators suggest a possible change in market sentiment for Stacks (STX). The divergences between the different time frame charts underline the importance of considering multiple perspectives when forming a trading strategy.
The crypto market is dynamic and rapidly evolving, and while technical analysis can provide us with a roadmap, it’s important to stay abreast of the broader market news, changes in regulations, and macroeconomic factors that can impact the crypto landscape. Remember, trading always involves risks and it's crucial to trade responsibly based on thorough research and analysis.
In the case of STX, a coin that plays such a fundamental role in the Bitcoin network, both the micro trends (as indicated by the hourly and four-hourly charts) and the macro perspective (
from the daily chart) offer crucial insights. The technical indicators suggest a potential upward trend in the short term, while the daily chart may indicate a period of consolidation. As always, staying tuned to market fluctuations is key in this exciting and unpredictable realm of cryptocurrency trading.
