STXUSDT Chart 1BIAS: Neutral
Currently Making a Higher Low from Recent Market Structure
Change of Character on 4HTF.
Getting Entry between 0.6202 - 0.6285
Stop Loss is 0.5980
TP1: 0.6519
TP2: 0.6677
Final TP: 0.6837
NOTE: This is just my Trading Journal Practice NFA
STXUSDT trade ideas

STX - Long $0.50 - $0.40 HTF SupportWeekly support level long. BTC smart contracts have a narrative now.

STX on crucial support zone#STX dumped -14% since perfect breakdown
Now it's testing support zone, wait for proper bounce or breakdown - retest confirmation before LONG or SHORT!

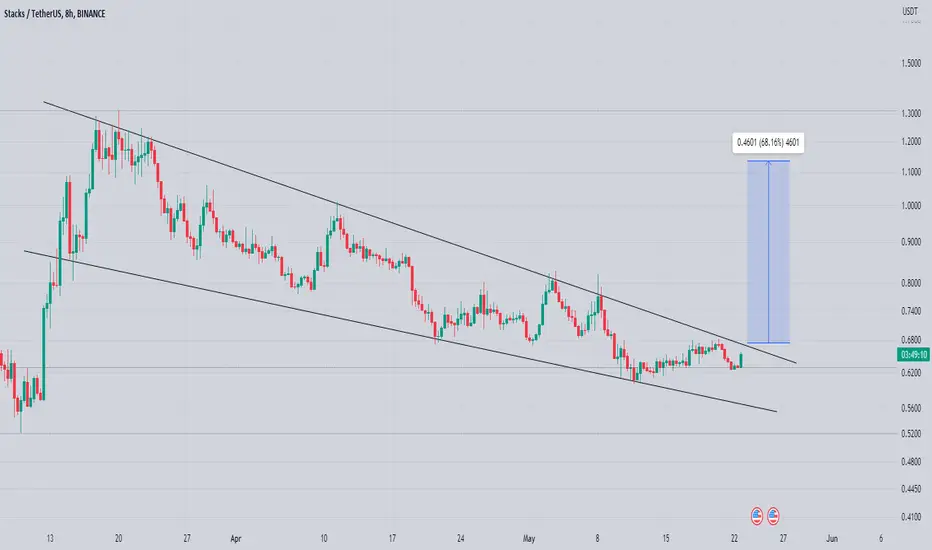
Stx Getting Ready For Massive Bullish impulse Seems Like getting Ready For Upside Continuation formed Falling Wedge In h8 Timeframe Incase Of Breakout expecting 65 to 70% bullish Wave
Indicators Signal Short-Term Buying Opportunity for STX (Stacks)I aspire, and expect Bitcoin to recover and resume its upward movement, with $STX ultimately closing the weekly candle above $0.84. Nevertheless, in technical analysis and trading, wishful thinking is not enough and holds no weight. The key is to identify conditions with a high likelihood of success.
Presently, $STX has fallen below $0.84 and is expected to continue its downward trend for the time being. Nonetheless, there is still hope for the short term.
The 'ZigZag Fibonacci Tool' has automatically mapped out several Fibonacci levels that could potentially serve as support zones in the future (see my green arrows)
Additionally, the Chris Moody Slingshot tool indicates a high probability of an upward tick around $0.77. The green candle colour suggests a conservative buying opportunity at present.
Furthermore, the TD Sequential countdown to 9 on the daily chart indicates a buying opportunity as it identifies turning points in asset or index price trends, printing a TD9 after nine consecutive candles above/below the previous four candles' closing price.
In conclusion, although Stacks has slipped through its support zone, favourable days are expected in the short term.
The current undervaluation of $STX makes it an attractive bargain.

STX DROP MORE VERY SOONHi, dear traders. how are you ? Today we have a viewpoint to BUY/SELL the STX symbol.
For risk management, please don't forget stop loss and capital management
When we reach the first target, save some profit and then change the stop to entry
Comment if you have any questions
Thank You

STXUSDT Ready to wait for BTC big move down and then fly!After a big breakout I expect a strong reaction from bulls in this area. which can cause a major trend reversal with the first target of prior high.
NFA

STX USDT LONGWe came to our very strong support. On D TF we bounced from 200 ema. If we stay above 0.8 $ we can go higher

STX USDT LONG SWING | STXUSDT | LONG @ 0.75 - 0.78 | TP @ 0.79, 0.8, 0.81, 0.82, 0.83 | SL @ 0.66 | PATTERN = ASCENDING CHANNEL | BINANCE |
Swing trade idea. Kindly follow targets and stop loss. Will update with new targets once all 5 are achieved. Mostly trading with PNF charts, MACD, RSI, Stoch, BPI, Cipher, MA/EMA, Support/Resistance on hourly timeframes and higher time frames
BINANCE:STXUSDT BINANCE:STXUSDT.P BYBIT:STXUSDT.P KUCOIN:STXUSDT COINBASE:STXUSD COINBASE:STXUSDT OKX:STXUSDT.P OKX:STXUSDT OKX:STXUSDC KRAKEN:STXUSD BINANCE:STXBUSD MEXC:STXUSDT.P

STX 4H Strong support and PAMPGood chanse to bounce from this support (circles), also the price was accumulating for 15 days and didn't break down. New market buy volumes.

STXUSDTHow do you do Crypto lovers,
*Mars Signals Team wishes you high profits*
This is a one-day-time frame analysis for STXUSDT
Here we have R2 which is our resistance area in this chart with the demonstration of the disability of the price to rise at various points. R1 used to be a support area. S1 is a 4-hour support area. And as you observe, S2 is a long-term support area at the bottom that involves the well support of price at some different points even since the past. Clearly, the price experienced a great increase after its support at S2 area and via some rejections and not being supported at higher amounts, it fell down to lower amounts and was supported at some points at S1. Then after a neutral behavior over this area, and receiving a negative Marubozu Candle with a shadow, which confirmed the high pressure of sellers there, we have its fluctuation above the first support area. Presently it is moving at this points and we expect it to give us some ranging process due to the existence of a doji candle that confirms the unstable situation of sellers and buyers in the market. After being supported here, then there would be a probability of a rise in the future. Also it is possible that the price falls below S1 via losing the support and more decline will take place then. When the price falls down to S2 after losing the support at S1, we must wait for the support and fixation of price and on its returning process, it is better to put your trade orders and then wait for more increase. According to the chart and considering the signs here, when the price is fluctuating above S1, we won’t have so much decline. So please consider the market situation in lower time frames and then decide what to do exactly. We suggest you to save your profits in the resistance areas due to the fact that in the decline of the price, you will not have so much loss. Keep moving with our updates and analyses to have multiple pieces of information and ideas.
Warning: This is just a suggestion and we do not guarantee profits. We advise you to analyze the chart before opening any positions.
Wish you the best

STX Coin Price Prediction✅ STX COIN PRICE ✅
🔥STX is trading at a nice resistance area but I will wait for Daily Candle Close🔥
If We see a Bearish Daily Candle closure ..
🚀There will be a 12%-28% Gains Opportunity🚀
👉 Follow me for more opportunities.

STXUSD ❕ broke up the trend lineThe asset is trading above liquidity.
Trading volumes are up.
RSI is moving in the bullish zone (4H, 1H and 30m TFs)
I believe that the price will continue to rise after overcoming resistance.

STX/USDT Looks bullishBINANCE:STXUSDT now stronger than other coins. Massive buy, when BINANCE:BTCUSD was falling.
Opened position at 0.73, good luck for me )

Stx Getting ready For Another Breakout Seems Like Getting Ready for Another Bullish impulse Forming bullish Pennant in h8 timeframe Incase Of Breakout expecting Bullish Move towards 1.50$

STXUSDT DAILYAs you can see, this currency formed a double bottom pattern at the end of its downward trend in the daily time, and then broke its downward trend line and is currently completing a pullback.
I expect to make a purchase in these areas for targets
0.8100
0.93
Let's see what happens :)


Short $STXI wanted to share with you some insights into my trading strategy. I have developed a system where I identify "buy zones" (indicated in green) and "sell zones" (indicated in red) to help me make informed decisions about when to buy and sell securities or assets.
Based on my analysis, I have noticed that in the red sell zones, there are typically two bounces, with the first bounce being a liquidation of short sellers. As of now, I believe it's time to sell, as I have identified a red zone where I anticipate prices to decrease.
Please keep in mind that trading strategies always involve risk, and it's important to have a solid understanding of market conditions and trends. I highly recommend conducting extensive research and seeking advice from a professional financial advisor to minimize your risks and increase your chances of success.
Thank you for your attention, and I hope that this information has been useful to you.

STXUSDT.P Long TradeSTXUSDT.P might go up but and reject around 0.9656 on the 4H chart.
Harmonic Pattern Indicator on the 4H is suggesting that their might be a potential dolphin pattern that might hit the order block around the 1.000 mark.
Although their is an ongoing G pattern in effect on the 4H chart, I think this might not push thru as the price has already rejected at 0.6763 and is looking to go up.
On the 1H chart a Bullish Dolphin might happen at 0.7825 which will be my entry point for a long position.
So, the bullish dolphin on the 1H complements my plan on the 4H chart wherein it might go up to the 1.00 mark
Possible Entry : 0.7825
SL: 0.7562
TP: 0.9619
R/R: 6.82


STX: Falling Wedge BreakoutTrade setup : Price reached $1.30 where price got rejected and pulled back. It was consolidating in a Falling Wedge pattern and had a bullish breakout, which could indicate a potential trend reversal to Uptrend with upside to $1.05 or even $1.30. Next Fibonacci retracement support level is $0.70 (78.6%) and the next horizontal support level is $0.60.
Patterns : Falling Wedge Usually results in a bullish breakout. When price breaks the upper trend line the price is expected to trend higher. Emerging patterns (before a breakout occurs) can be traded by swing traders between the convergence lines; however, most traders should wait for a completed pattern with a breakout and then place a BUY order.
Trend : Downtrend on Short-Term basis, Neutral on Medium-Term basis and Uptrend on Long-Term basis.
Momentum is Mixed as MACD Line is above MACD Signal Line (Bullish) but RSI ~ 50 (Neutral).
Support and Resistance : Nearest Support Zone is $0.55. The nearest Resistance Zone is $1.05, then $1.30.

#Shorting #STX #ScalpEntriesHi Padawans,
Planning to get some short scalps around marked orange lines.
Manage your risk!
May the force be with you.
Cheers

Stacks longStacks broke trough the descending trendline. Asset broke trough the resistance level. Bullish movement to resistance level at 0.98 is expected to happen.
