STXUSDT| BREAKOUT..STX trading in a bearish trend .
The price has been trading under the falling resistance since a long time.
Now the price has broken above the falling resistance.
We have an excellent upside targets as price has printed bullish candles.
Manage your levels accordingly. e.
STXUSDT trade ideas


STX/USDT | Pretty Solid Breakout..!!
#STX Falling Wedge Breakout has Confirmed in the Daily TF Chart..!!
Looks Promising for the Midterm Hold..
Expecting +200-250% Bullish Wave in the Midterm So Keep it under the Radar.
Please like the idea for Support & Subscribe for More ideas like this and share your ideas and charts in Comments Section..!!
Thanks for Your Love & Support..!!

STX Hidden Bullish Divergence must hold .14c A 20x next cycle e Not financial advice.
Like and follow
I will say short but I'm super bullish long term.
I believe this token has potential to hit 3.00-5.00 and as high as 10.00 when bullish conditions come back.
I tried to explain as best as I could.
But .14c is the key entry area but also the key area to hold.
We have a Huge Hidden Bullish Divergence on the Stoch Rsi with an optimal entry of around the 25 area on Stoch RSI.
If we happen to lose .14c
I'd look at .03c as entry.
This token is definitely one you don't wanna sleep on Long term.
The potential is thru the roof especially when regulations come this will be one of the few that survive.
Always DYOR
#PIK
Patience is Key
#TLAW
Think Like A Whale


STXUSDTSTXUSDT resistance seems to be holding very nicely. I expect a move downward. A sell position is opened, now we wait and see how the market behaves.

STX
#STX/USDT
Exchanges: Binance
Signal Type: Regular (Long)
Amount: 2.0%
💎 Entry Targets:
1) 358-330
Take-Profit Targets:
Target 1: 363
Target 2: 370
Target 3: 381
Target 4: 394
Target 5: 412
Target 6: 446
Target 7: 490
Target 8:
🚫 Stop loss:
320

STX/USDTConfirmed breakout on the ascending channel present. Buy the retest at the 61.8 Fib level and take 1st profits at previous resistance looking left. Take 2nd profits at previous resistance on the Daily TF.

STXUSDT: Flexible Trading PlanLet's consider an excellent situation on the STXUSDT.
Based on the current wave structure, I plan the opening of a long position or the opening of a short position.
On the one hand, the current corrective in wave 4 may end up forming a WXY pattern; on the other hand, the current corrective pattern in wave 4 may end up forming a triangle pattern.
It is advisable to open a long position at a breakdown of the top of the presumed wave 1 in wave C of wave Y (after the completion of wave 1 and the formation of a local correction in wave 2).
Opening a short position is relevant in case of a breakdown of the low of the triangle pattern - the minimum of wave D.
In both cases, with a moderately aggressive approach, it is possible to extract a good profit in a short period of time.

STACKS WARNINGStacks is an open source blockchain network that provides decentralized applications (dApps) and smart contracts for Bitcoin
Think about it! Smart contracts for Bitcoin! This is a huge uncultivated field. No wonder they managed to scam crypto and financial sharks into their project
Their #STX coin is the first coin to have a token sale under the full control of the US Securities and Exchange Commission (SEC). They were able to fulfill all their requirements FIRST!
◻️People like Andreas Antonopoulos and Edward Snowden spoke at conferences dedicated to the project
◻️I will not torture myself and you with complex terms, since almost always the success of a project lies in the team and marketing. A good team doesn't take on a bad project.
◻️According to my information, in the FALL the project plans to attract the giants of the cryptocurrency market, which will give rise to an extensive marketing campaign, which, coupled with innovative developments, should attract the interest of a huge number of retail investors
◻️Especially noteworthy is the fact that #STX is traded on almost all popular cryptocurrency exchanges, and the technical picture for buying is now excellent:
◻️I took 10% of the portfolio without any hesitation. I will hold part of it until the end of the upcoming bullrun, I will leave part of it for a long time

Stxusdt bullish diaversionHii everyone I am today technical analysis stxusdt 4hrs time frame m I found bullish diaversion you need any coin anaylsis post in commnets below box here I will share your coin anaylsis.

STXUSDT🔥 300% for the long termSubscribe to a channel that would receive new information about the cryptocurrency market✅
Greetings to all👋
I found another coin for the long term, I think that due to the fall of bitcoin below $ 20,000, the price will test the $ 0.269 zone, this can be called a zone of interest for buying in the long term.
The asset is moving in a downward wedge, I think that in a month or maybe less, the price will be able to break through the resistance level of the pattern and show us the profit movement)

STXUSDT | BREAKING OUTSTXUSDT has given a breakout from the falling resistance trendline. We are expecting a retest to the level again and more confirmed once the horizontal level is taken out.
One can build a position with mentioned stop loss level and ride the upcoming bullish trend.
Trade your levels accordingly.

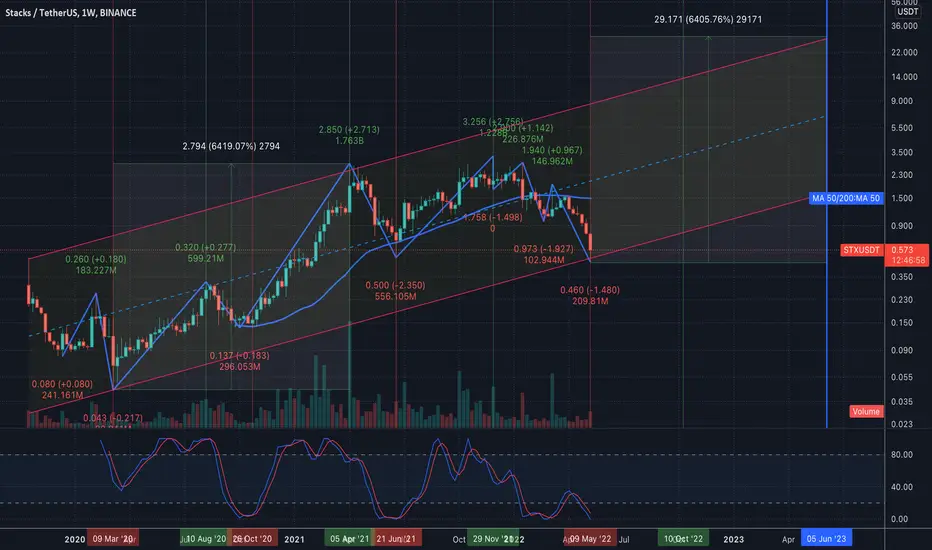
Stacks has bottomed at the 0.618 Fibonacci retracementSTXUSDT has put down a textbook 0.618 Fibonacci retracement correction on the weekly chart.
In my Elliott Wave count, the last impulsive wave was a truncated fifth. In a new wave count, the retracement to the 0.618 Fibonacci is a corrective wave 2. Such a correction is not unusual for a corrective Wave 2.
The Tom Demark (TD) Sequential Indicator indicates a 9-candle count. This usually means that a bottom has been reached and a trend reversal will occur. It indicates a set-up to take a position in the market.
I have additionally used the Chris Moody Indicator "RSI Strategy Lower". This indicates by means of the RSI that a bottom has been reached. This can also be seen by the formed horizontal green line; this is now starting to move upwards.
If STXUSDT is preparing for an impulsive wave 3, interesting times are coming...

STX USD James Bond Pattern 007Daily Chart
Gan Box Cycle 50 % Retrace on Yearly Timeframe
or
Gan Box Cycle 50 % Retrace on 6 month Timeframe
Gamma.io
Earn Btc with STX Proof of Transfer

#STXBreaking 0.5 daily with a high selling volume, we will see the negative targets in which the investor should be careful of them

STXUSDTHello everyone, I took a short position in the downtrend market, because the price could not break the channel validly, I got the target a little higher than the midline, because my time frame is 4 hours to be wise, I took the loss limit above the last peak, successful And be professional.

Long STX\USDTlooking at a longer period …
Stacks is a layer-1 blockchain solution that is designed to bring smart contracts and decentralized applications (DApps) to Bitcoin (BTC). These smart contracts are brought to Bitcoin without changing any of the features that make it so powerful — including its security and stability.
STX USDT BUY AREAS SHORT TERM LONG EASY 25 PERCENT if you need long term investement plan just follow us on twitter or instegram
stop loss 1.09


STX/USDT Technical analysis CRYPTOCurrent technical analysis for STX/USDT if you have any questions or criticism towards my analysis feel free to leave them in the comments!
FORECAST FOR ONLY IF PRICE REACHES THE TARGETS IF IT DOES NOT THEN THIS GRAPH DOES NOT IMPLY TOWARDS ANY OTHER PRICE TARGET!!!
Red line = current support
Orange line = current resistance
Yellow line = future resistance
Green line = future resistance
White arrows = what i think will happen
Yellow line = can happen but less likely
FORECAST ONLY FOR WHETHER THE PRICE WILL REACH THE BOTTOM OF THE DIAGONAL SUPPORT IF IT DOES NOT IT MAY BREAK THROUGH AND ENTER MUDDY GROUNDS!!!


Chart looks appealing Potential 30% profit
1- Bullish symmetrical triangle formed.
2-MACD about to crosse above the zero.
3- Price has barely broke the resistance but with very low volume.
Trade should be taken after a strong breakout with big volume.
Lastly, it all depends on bitcoin movement.
