STXUsdt UpdateThis Kevin is moving slowly now.
But it has the potential to move up and pump up at full power at the same time
Wyckoff show you now chanse for sec entry money
GL
Supprts:
1.501>>> Entry Point
1.320
1.163
0.993
0.770
Resistance:
1.799
Targets:
2.265
2.665
3.038
3.542
4.415
For HODL:
6.662
8.936
12.977
GL
STXUSDT trade ideas

STX Up 2.47% from PreliminarySTX has netted me a 2.47% return since taking a 1.585 preliminary entrance yesterday.
Prognosis: I'm just going to let STX run its course. It had a brief retest of the 1.0 Fibonacci, passed, and is now making headway to the 1.272%. Fine with me.
*Fulltime Wyckoffian VSA crypto swing trader since 2017. I regularly seek out the most lucrative swings on all the major exchanges.
All my charts are clean, straightforward, and easy to follow. No junk, no needless indicators, just solid volume spread analysis ( VSA ) and 'take-the-money-and-run' Fibonacci target zones.
I go after the runners and big money. My win rates are between 80-85%. Follow me on TradingView and see for yourself.
I review over 300 coins & tokens daily and handpick all the runners myself (no bot signals).
** Not financial advice. Trade at your own risk.


STX / USDT Broke through Resistance level of 1.5291 (Black) Possible bullish price movement forecast for the next 13 days towards 1.7741.

STXUsdt UpdateItry clean chart for cans ee targets and your plan on chart
Stx have potential for move up soon
better rdy for that after break resistance
good luck
Supports:
1.500 >>> Entry Point
1.365 >>> Sec EntryPoint
1.222
1.097
Resistance:
1.594
Targets:
1.941
2.496
2.849
3.438
HODL Trgets:
4.897
6.296
8.675
Gl
Have Good trade


STXWhat Is Stacks (STX)?
Stacks is a layer-1 blockchain solution that is designed to bring smart contracts and decentralized applications (DApps) to Bitcoin (BTC). These smart contracts are brought to Bitcoin without changing any of the features that make it so powerful — including its security and stability.
These DApps are open and modular, meaning developers can build on top of each other's apps to produce features that are simply not possible in a regular app. Since Stacks uses Bitcoin as a base layer, everything that happens on the network is settled on the most widely used arguably the most secure blockchain in operation — Bitcoin.
The platform is powered by the Stacks token (STX), which is used for fueling the execution of smart contracts, processing transactions and registering new digital assets on the Stacks 2.0 blockchain.

SWING TRADE - INTRADAY STXUSDT - LONGDETAILS ON THE CHART!!!
Intraday swing trade for STXUSDT, Pair is showing bullish trend in 1 day chart, and on 1 hour chart we have a potential trade opportunity!!!
Let See!!

Stacks STXUSDT - Head and shoulders + NEW ATH + 600%!- STX is forming an inverse head and shoulders pattern on the daily candles, which is a bullish reversal pattern.
- Volume favors bulls, as there is not any selling pressure.
- All time high resistance 2.85 can act as a resistance.
- The price is above a trendline from 2020.
- For expected duration of the trade, probability, stop loss, profit target, entry price and risk to reward ratio (RRR) - please check my signature below ↓
- If you want to see more of these ideas, hit "Like" & "Follow"!


STXUsdt (Stacks) Rdy fro going upStx chart is so ggod position and rdy for going up
can see 1 lemon trend line resisdance and need break that but have good chanse for going up .
show you enter areaon chart
and this triangle can break up
you can set little triangle but i show big triangle
good position and on future days can going up on this week
GL guys
Supports:
1.3204 >>>> Enter Point
1.1625 >>> this best enterpoint but have low chanse
0.9934
0.8581
Blue and green Trend line is resisdance close and last resisdanc ecan both break with 1 candle.
Resisdance:
1.5000
Targets :
1.7981
2.2651
3.0378
3.5412
4.4121
Targets For HODL:
6.6631
8.9344
GOAL:
12.9775
GL GUYS


STX LONG----------------------------
STX long opportunity
----------------------------
Personal Idea

STX: Inverted H&S Neckline Momentum Inverted H&S with demand surge for STX. I entered early at 1.2324 and expect to ride this up to the Fibs after some sideways consolidation.
*I regularly seek out the most lucrative crypto swing trades on all the major exchanges.
My win rates are between 80-85%.
All my charts are clean, straightforward, and easy to follow.
** Not financial advice. Trade at your own risk.

STX/USDT Robert Miner Strategy 4HSTX/USDT 4h time frame have a PRZ Between 1.331 ~ 1.360
when the fifth wave is completed, price enters the PRZ area (1.331 ~ 1.360) and if the momentum indicators(RSI / DT / STOCHASTIC AND ...) Confirms it, we can expect the price go to down.


Good profit on STX/USDTAs you can see there is a good opportunity on this token with good risk/reward.
Don't forget about stop-loss

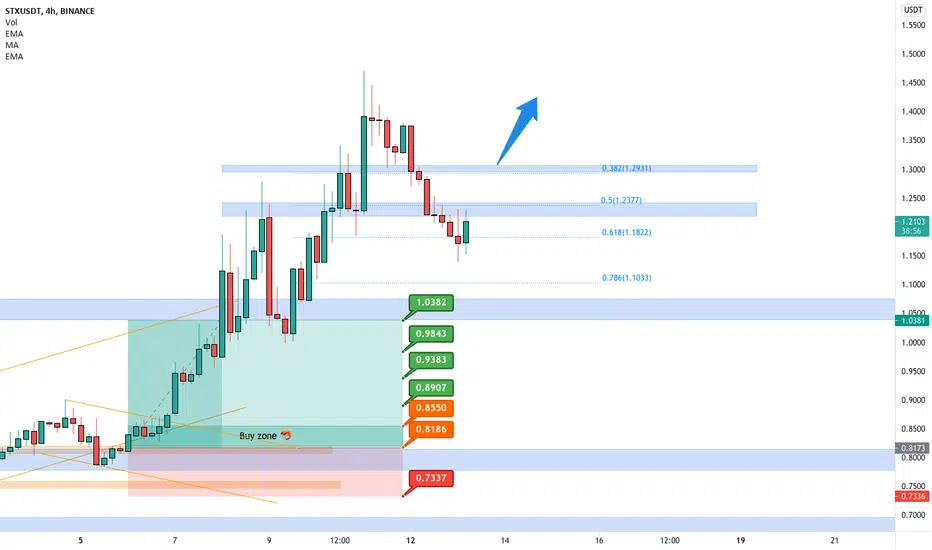
STXUSDT is testing 0.618 🦐STXUSDT is testing 0.618 after an amazing Profit in our VIP GROUP. IF the price will have a breakout from daily resistance , According to Plancton's strategy (check our Academy), we can set a nice order
–––––
Follow the Shrimp 🦐
Keep in mind.
🟣 Purple structure -> Monthly structure.
🔴 Red structure -> Weekly structure.
🔵 Blue structure -> Daily structure.
🟡 Yellow structure -> 4h structure.
⚫️ Black structure -> <4h structure.
Here is the Plancton0618 technical analysis, please comment below if you have any question.
The ENTRY in the market will be taken only if the condition of the Plancton0618 strategy will trigger.
Either wedge or bounceThis could bounce off the 200 day MA and move higher or first move lower (.50 and .90 support) and continue forming what looks to be a bit of a wedge while the market corrects. If the latter occurs, a breakout would constitute a move above the purple line.
Can also see the MACD looks potentially calling for a move lower.
Paying attention to accumulation as well, as it has picked up recently but mellowed out a bit.
Either way, I think I like this as a trade.


STXUSDTHello to you all. Mars Signals team wishes you high profits at all times.
As you can see, the price is trapped in a triangle. If it comes out from the top, we have determined the resistances for you, and if it comes out from the bottom, we have determined the support for you.
Warning: This is just a suggestion to you and we do not guarantee profits.
Wish you luck!

This is BullishSTX has been in this consolidating for a while and it's starting to approach that D1 trendline. Am still wait for the 4H timeframe to start showing bullish structure(higher highs) but I love how this chart is playing out.

