Stacks (STX): Preparing for a Massive Rally – $4.35 and Beyond!📈 Stacks (STX): Preparing for a Massive Rally 🚀 – $4.35 and Beyond!
STX is gearing up for its next big move, and with its correlation to Bitcoin’s bullish momentum, it could be positioned for a 3x to 20x surge. The primary target of $4.35 is on the horizon, and in an ultra-bullish moonshot scenario, the $19 maximal target could be achieved. Let’s break it down.
Key Levels to Watch on the 8H Chart
Immediate Support: $1.50 – This level is currently holding well and forming the base for the next leg up.
Major Resistance:
$2.76: The first key level that STX needs to clear to build momentum.
$4.35 (Primary Target): A significant milestone and the next bullish objective.
Moonshot Scenario: $19 – This represents a maximal target, aligning with strong macro bullish conditions.
Why STX Could Explode
Bitcoin-Driven Momentum:
STX often mirrors Bitcoin’s price action, with amplified gains during BTC rallies. If Bitcoin continues to climb, STX could multiply its value.
Smart Contracts for Bitcoin:
Stacks enables smart contracts and dApps on Bitcoin, making it uniquely positioned to benefit from Bitcoin's dominance in the crypto space.
Growing Ecosystem:
More developers and projects are building on Stacks, increasing demand for STX tokens to fuel smart contracts and transactions.
Undervalued Opportunity:
Despite its pullback, STX’s fundamentals remain strong, presenting a high-reward opportunity at current levels.
The Path Forward
STX is primed for a strong move, with $4.35 being the most realistic short-to-medium-term target. If Bitcoin continues its bullish momentum, STX’s moonshot to $19 could become a reality, offering exponential gains.
Do you think STX can achieve the $19 maximal target? Drop your thoughts below and let’s discuss! 👇
One Love,
The FXPROFESSOR 💙
STXUSDT trade ideas

Is STXUSDT Setting Up for a Big Move? Don’t Miss These Key LevelYello, Paradisers! Is STXUSDT quietly building momentum for a major breakout? Let’s dive into the current market structure to see if we’re on the verge of a bullish opportunity — or if caution is the smarter play.
💎STXUSDT is showing bullish I-CHoCH (Internal Change of Character) and BOS (Break of Structure) on higher timeframes — a good sign that buyers are gaining control. The current retracement adds more weight to this setup, making it an attractive opportunity if we see further confirmation on lower timeframes.
💎The double-bottom pattern forming is another bullish signal. However, instead of jumping in early, it’s smarter to wait for a bullish I-CHoCH confirmation on lower timeframes to increase the probability of success.
💎If we get a deeper retracement or sudden panic selling, our focus will shift to the strong support zone below. This is where we expect a bounce, and once again, we’ll be watching for bullish I-CHoCH on lower timeframes to confirm the reversal.
💎If STXUSDT respects that support, we’re in a good position. But...
💎If the price breaks down and closes a candle below the strong support zone, that will invalidate the entire bullish idea. In that case, we step back and wait for better price action to form. No need to rush — the market will always give more opportunities if you stay patient and disciplined.
Play It Smart, Paradisers! At this point, it’s all about waiting for confirmation and avoiding emotional trades. The crypto market loves to punish impatience, but the disciplined traders always win in the end.
MyCryptoParadise
iFeel the success🌴

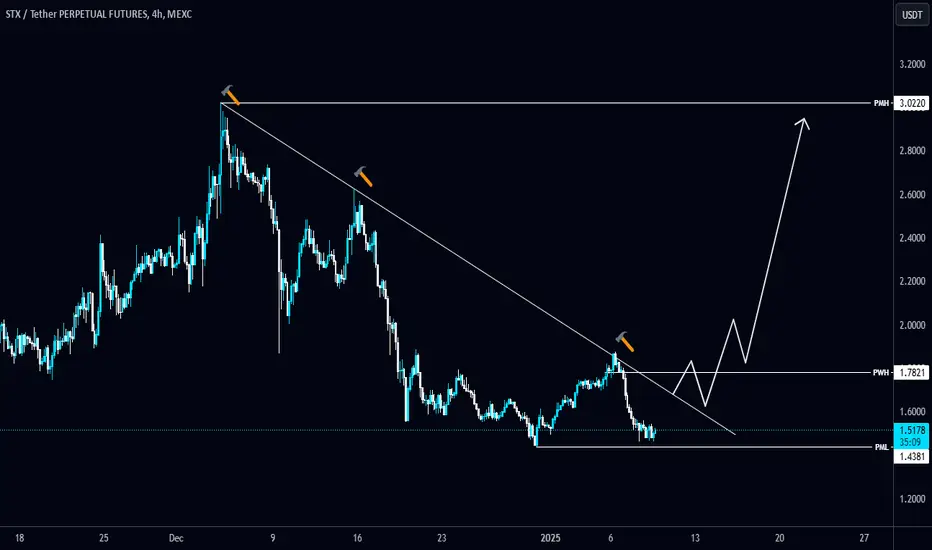
#STX/USDT AnalysisNASDAQ:STX is rejecting from the Diagonal Trendline in 4-Hour TF!
📈 Key Levels:
Resistance: PMH $3.022
Support: PML $1.4381
💡 NASDAQ:STX needs to break and hold above the trendline to turn bullish.

STXUSDT 1WSTX ~ 1W
#STX if you still have Conviction on the coin,. This support block would be a very good buying place for now,. Target at least 20%+ from here.

Basic Trading Strategy: Stacks MyProfitsStacks has plenty of room to grow in 2025 including a new All-Time High. We have a beautiful chart here.
A major resistance (black line) was conquered in December 2023. This resistance was later tested as support in August 2024. Support has been confirmed.
Using this level we can divide the chart into a bullish and bearish zone. STXUSDT is now trading in the bullish zone and looking ready to grow.
A strong bullish signal comes based on the fact that STXUSDT is producing higher lows. Even with this super strong support, it is not being tested again after August, it remains unchallenged. This is a signal of strength.
We currently have a full green 3D session, most likely the resumption of the bullish trend.
This will be a long-term process. Higher highs and higher lows. Long-term growth. Higher prices. Stacks moving up. This is a great pair for those that like to "set it and forget it." You can buy it now and comeback in 6-8 months.
Based on this long-term strategy, we have a good entry because the action is happening near support. The best time to buy is when prices are low near support.
If there is another drop, nothing happens, we simply hold or buy more. Every time prices drop, we buy more. When the market turns, we enjoy growing profits with each passing day.
Patience is key. This is as simple as it gets.
Thank you for your interest and for your continued support.
You are appreciated.
Thank you for reading.
I hope to see you soon again.
Namaste.

cup and handle chart patternwhen its break 1.6412 we wait to pull back to near 1.64 and then buy to 1.74 target or do risk free. its is depends on you when you close your trade.

STX buy/long setup (4H)Considering the breakout of the trigger line, the price structure shift, and the creation of a demand zone, we can look for buy/long positions on STX during pullbacks.
The target could be the red zone.
We should enter the position at the green zone to minimize risk.
Closing a daily candle below the invalidation level will invalidate this analysis.
For risk management, please don't forget stop loss and capital management
Comment if you have any questions
Thank You

STX - Bullish Divergences on the 4hBullish divergences tend to resolve in higher price. Selling momentum dissipating.

The last bullish chance of STX in Mid term!As you can see, the price is in an ascending triangle and is also forming the handle of a cup and handle pattern. Each of these patterns indicates a bullish trend in the medium term. We just need to wait for these patterns to break out to reach the desired target.
Give me some energy !!
✨We spend hours finding potential opportunities and writing useful ideas, we would be happy if you support us.
Best regards CobraVanguard.💚
_ _ _ _ __ _ _ _ _ _ _ _ _ _ _ _ _ _ _ _ _ _ _ _ _ _ _ _ _ _ _ _
✅Thank you, and for more ideas, hit ❤️Like❤️ and 🌟Follow🌟!
⚠️Things can change...
The markets are always changing and even with all these signals, the market changes tend to be strong and fast!!

STXUSDT in coming daysHi
Stacks is in an overall uptrend, moving within an ascending channel💁♂️
After testing the upper boundary of the ascending channel, the price pulled back🫠
After breaking down below the MA 50, expect a potential move towards the lower boundary of the channel🔻
Stay awesome my friends.
_ _ _ _ _ _ _ _ _ _ _ _ _ _ _ _ _ _ _ _ _ _ _ _ _ _ _ _ _ _ _ _ _
✅Thank you, and for more ideas, hit ❤️Like❤️ and 🌟Follow🌟!
⚠️Things can change...
The markets are always changing and even with all these signals, the market changes tend to be strong and fast!!

STX LONGthis chat have be long
for use this analyse please mony mangement
and set tp or stop loss
there is best channel and support

SPOT STX LONG 24.12.2024Pinning after containment of sales.
🎯Purpose:
2.32
‼️Risk per trade: 0.5% of the allocated funds for spot trading.
Thank you for subscribing and responding🚀.

CONGRATULATIONS STACKS!! New ATH & a Cycle Two coinBuild on Bitcoin
is a powerful narrative
do you have exposure??
Most Altcoins DO NOT make new high's cycle to cycle
So when one does you must applaud it as it gives much hope to all the shitcoin holders out there
Stacks looks like it has more room to run

The Future of STXUSDT: A Look at the Key Catalysts - Stacks◳◱ On the BINANCE:STXUSDT chart, the Bband Breakout pattern suggests a consolidation phase that could precede a trend continuation or reversal. Traders might observe resistance around 2.817 | 3.178 | 3.998 and support near 1.997 | 1.538 | 0.718. Entering trades at 2.49 could be strategic, aiming for the next resistance level.
◰◲ General Information :
▣ Name: Stacks
▣ Rank: 56
▣ Exchanges: Binance, Kucoin, Gateio, Mexc
▣ Category / Sector: Infrastructure - Smart Contract Platforms
▣ Overview: Stacks (formerly Blockstack) provides software for internet ownership, which includes infrastructure and developer tools to power a computing network and ecosystem for decentralized applications (dApps). Its focus is to replace the reliance on centralized cloud service providers and apps that harvest and monetize user information. The Stacks network allows users to directly own digital assets like usernames, domain names, computer programs, etc. On the Stacks blockchain, computing is done on the edges (i.e., client devices), and applications on the platform store data individually and use the blockchain only when necessary.
◰◲ Technical Metrics :
▣ Current Price: 2.49 ₮
▣ 24H Volume: 85,569,157.492 ₮
▣ 24H Change: 3.063%
▣ Weekly Change: 2.63%%
▣ Monthly Change: 25.12%%
▣ Quarterly Change: 68.55%%
◲◰ Pivot Points :
▣ Resistance Level: 2.817 | 3.178 | 3.998
▣ Support Level: 1.997 | 1.538 | 0.718
◱◳ Indicator Recommendations :
▣ Oscillators: NEUTRAL
▣ Moving Averages: STRONG_BUY
◰◲ Summary of Technical Indicators : BUY
◲◰ Sharpe Ratios :
▣ Last 30 Days: 3.91
▣ Last 90 Days: 2.21
▣ Last Year: 1.28
▣ Last 3 Years: 0.53
◲◰ Volatility Analysis :
▣ Last 30 Days: 1.01
▣ Last 90 Days: 1.00
▣ Last Year: 1.12
▣ Last 3 Years: 1.17
◳◰ Market Sentiment :
▣ News Sentiment: N/A
▣ Twitter Sentiment: N/A
▣ Reddit Sentiment: N/A
▣ In-depth BINANCE:STXUSDT analysis available at TradingView TA Page
▣ Your thoughts matter! What do you think of this analysis? Share your insights in the comments below. Your like, follow, and support are greatly valued and help sustain high-quality content.
◲ Disclaimer : Disclaimer
The content provided is for informational purposes only and does not constitute financial, investment, or trading advice. Always conduct your own research and consult a qualified professional before making any financial decisions. Use of the information is solely at your own risk.
▣ Explore the Power of Charting with TradingView
Unlock a wide range of financial analysis tools, data, and features to elevate your trading experience. Take a tour and see the possibilities. If you decide to upgrade your plan, you can receive up to $30 back. Discover more here - affiliate link -

stx - ascending triangleThe btc ecosystem looks strong, STX has formed an ascending triangle, growth potential is noted on the chart at $7, $15

STX/USDT Price Prediction - 1WTrend Prediction - STX/USDT Forecasting
Resistance and Support Lines
**** Yousef Sharafi ****
Follow me here for more analysis

STXUSDT: %100 VOLUME SPIKE DAILY | Key Zones IdentifiedSTXUSDT has seen a 100% increase in trading volume within the past 24 hours.
🔵 Key Zones: The highlighted areas on the chart are potential demand zones, designed to prepare for possible bearish market conditions as we approach year-end.
📈 Entry Strategy: Avoid acting on these zones unless confirmed by upward breakouts on the 15-minute time frame.
⚠️ Risk Management: Exercise caution, as buyers have yet to show significant activity. Always manage your risk carefully.
This is not investment advice. Trade wisely and plan for market volatility!
I keep my charts clean and simple because I believe clarity leads to better decisions.
My approach is built on years of experience and a solid track record. I don’t claim to know it all, but I’m confident in my ability to spot high-probability setups.
My Previous Analysis
🐶 DOGEUSDT.P: Next Move
🎨 RENDERUSDT.P: Opportunity of the Month
💎 ETHUSDT.P: Where to Retrace
🟢 BNBUSDT.P: Potential Surge
📊 BTC Dominance: Reaction Zone
🌊 WAVESUSDT.P: Demand Zone Potential
🟣 UNIUSDT.P: Long-Term Trade
🔵 XRPUSDT.P: Entry Zones
🔗 LINKUSDT.P: Follow The River
📈 BTCUSDT.P: Two Key Demand Zones
🟩 POLUSDT: Bullish Momentum
🌟 PENDLEUSDT.P: Where Opportunity Meets Precision
🔥 BTCUSDT.P: Liquidation of Highly Leveraged Longs
🌊 SOLUSDT.P: SOL's Dip - Your Opportunity
🐸 1000PEPEUSDT.P: Prime Bounce Zone Unlocked
🚀 ETHUSDT.P: Set to Explode - Don't Miss This Game Changer
🤖 IQUSDT: Smart Plan
⚡️ PONDUSDT: A Trade Not Taken Is Better Than a Losing One
💼 STMXUSDT: 2 Buying Areas
🐢 TURBOUSDT: Buy Zones and Buyer Presence
🌍 ICPUSDT.P: Massive Upside Potential | Check the Trade Update For Seeing Results

The Road to $66 for STXUSDT (Stacks)$STXUSD has now beautifully broken out of the triangle after an impressive textbook correction at the 0.618 Fibonacci retracement.
This type of correction is a typical feature of wave 2 in an Elliot wave count, which indicates that $STXUSDT is now ready to embark on its third impulsive wave, often referred to as the most explosive one.
Considering the increasing volume, an explosive surge in the number of transactions on the network, and the oscillators, we can expect a swift development in the price towards the following resistance levels:
— 0.57
— 1.06
— 2.85
— 5.96
— 8.16
— 13.17.
#stxusdt #stxusd #BNS #DeFi #BitcoinNFTs #Stacks

stx is gonna rise !#stx is making an ABCDE pattern we are going to reach the E wave maybe the market make a correction but it will rise anyway

STX has gained over 200%.From the point where we placed the green arrow on the chart, it appears that STX has entered a large diametric pattern.
It now seems that wave D has completed, and the price has entered wave E.
As long as the green zone is maintained, it can move toward the target above $7.
Closing a daily candle below the invalidation level will invalidate this analysis.
For risk management, please don't forget stop loss and capital management
Comment if you have any questions
Thank You


STX Looks BullishI shared this one before, and wanted to followup. As you can see, price broke resistance at $2.06 and has retested it as support. This should easily target the recent $3.85 highs from March, assuming alts continue to boom.
Trading Alpha is showing a big grey arrow, a break above the trackline and grey dots here on the weekly. A lot to love
