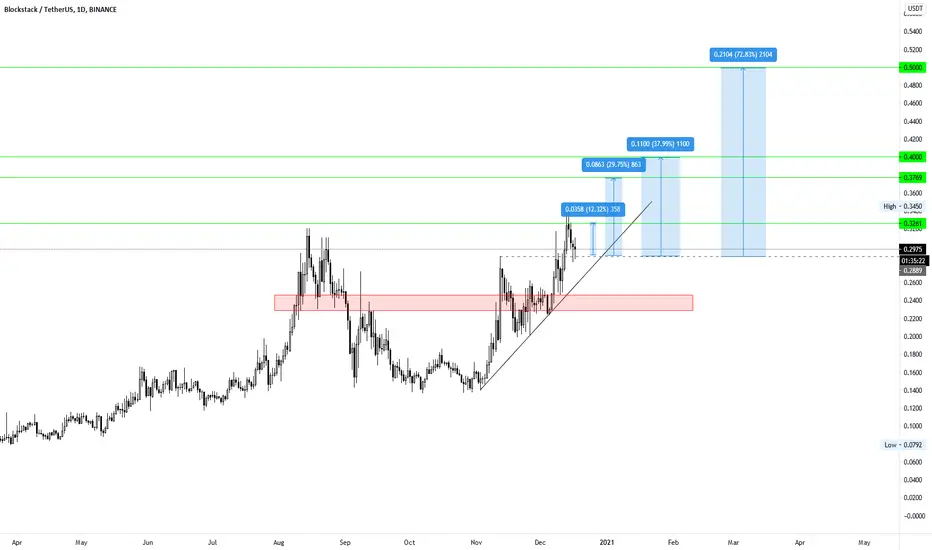
blockstack a good option for medium-term investment.🍕STX/USDT (1D) has several events in the coming months and will grow well due to the uptrend of the daily chart and good support at low prices.🚀🚀
STXUSDT trade ideas

STXUSDT completing Cypher | 29.9% expectedOn small time period one hour chart, the price action of Blockstack (STX) is completing the final leg of Cypher pattern , and soon it will be entered in potential reversal zone. There is also 200 simple moving average support in PRZ level.
Buying And Sell Targets:
The buying and sell targets according to BAT pattern should be:
Potential reversal or buying zone: $0.2704 to $0.2501
Fibonacci projection or sell zone: $0.2863 to $0.3249
Stop Loss:
The potential reversal zone area that is up to $0.2501 can be used as stop loss in case of complete candlestick closes below this level.
Possible profit and loss ratio:
As per above targets this trade has a profit possibility of 29.90% and as per the above-mentioned stop loss, the loss possibility is 8%.
Note: Above idea is for educational purpose only. It is advised to diversify and strictly follow the stop loss, and don't get stuck with trade.

STX will Rise again in few hoursSTX/USDT is in a rising channel and going to up after a retrace and will gain 7% in few hours
buy: 0.2990
TP1: 0.3200 (0.786 FIBO)
SL: 0.2950

STXUSDT LONG TRADESTXUSDT LONG TRADE
Signal: Blue -> Green
Context: Light Green
Trade close manually when: the above ribbons turns Yellow or better Red.
I appreciate your like or comment. Welcome to share your idea here.
DISCLAIMER
This is only a personal opinion and does NOT serve as investing NOR trading advice.
Please make your own decisions and be responsible for your own investing and trading Activities.


STXUSDT - Long - Potential 8.91%STXUSDT - Long - Potential 8.91%
Entry- 2433
TP1- 2557
TP2- 2642
SL- 2256
- MANAGE TRADES- BTC VOLATILITY STILL HIGH
- RR - 1.28
- Trailing Buy - 0.5%
- Trailing Profit - 1%
- Trailing Stop-Loss - No

STX/USDT - Long - Potential 11.18% ***NEW TRADE SET_UP"**
STX/USDT - Long - Potential 11.18%
Optional Leverage: N/A
Entry- 2371
TP1(75%) -2508
TP2- (25%) - 2636
SL- 2194
- MANAGE TRADES- BTC VOLATILITY STILL HIGH
- RR - 1.5
- Trailing Buy - 0.5%
- Trailing Profit - 1%
- Trailing Stop-Loss - No


STXUSDTPERP - Long - Potential 17.71%***NEW TRADE SET_UP"**
STXUSDTPERP - Long - Potential 17.71%
Optional Leverage: 3X - 5X
Entry- 2338
TP1(75%) - 2533
TP2- (25%) - 2752
SL - 2160
- MANAGE TRADES- BTC VOLATILITY & BIG DROP POSSIBLE
- RR - 2.33
- Trailing Buy - 0.5%
- Trailing Profit - 1%
- Trailing Stop-Loss - No

STXOn the chart we can see bearish channel we follow, but i also marked Fibonaci retracement from D1 chart last price break. On 1 hour chart it looks like we are in golden support zone fibonaci retracement and we are slightly down on long term trend line from March 2020. But on D1 chart is only overlaping or candle knots. If we break this long term support line we can see bullish pump at least to target fibo 0,236.

STXUSDT is trying to have a breakout 🦐STXUSDT is trying to have a breakout from the dynamic daily trendline and static daily resistance
IF the price will have a breakout, According to Plancton's strategy, we can set a nice order
–––––
Follow the Shrimp 🦐
Keep in mind.
🟣 Purple structure -> Monthly structure.
🔴 Red structure -> Weekly structure.
🔵 Blue structure -> Daily structure.
🟡 Yellow structure -> 4h structure.
⚫️ Black structure -> <4h structure.
Here is the Plancton0618 technical analysis, please comment below if you have any question.
The ENTRY in the market will be taken only if the condition of the Plancton0618 strategy will trigger.

STXUSDT 4H - Possible bear flagPossible bear flag on stxusdt after a descending triangle breakout.
Possible bullish diversion on MACD.
STX has an upcoming mainnet event in around 6 weeks.
Play safe, and remember to check BTCUSDT and BTC .D before book your positions.
** Not financial advisor, only playing around and learning.


STXUSDT - LONG - POTENTIAL 16.90%STXUSDT - LONG - POTENTIAL 16.90%
Entry - 2112
TP1 - 2219
TP2- 2473
SL- 1936
Please comment with thoughts and how you get on.
If you like the idea, then hit like on the idea & support with a follow.
Good luck out there & Your investments are your responsibility.

STXUSDT AnalysisPeople who bought STX from the BULL signal in July, enjoy your 68.22% PROFIT that you made less than 2 months!
There's also green cloud present as a buy signal.
if you are holding STX, do not hurry to sell since there are no sell signals present. If you want, you can take profit at the resistance level (0.37) or wait for EngineeringRobo's sell signals to sell.
Also, if you haven't bought STX, since there are 2 buy signals present & the risk-reward ratio is higher than 1, you can buy right now. If you buy, please watch out for EngineeringRobo's sell signals.

STXUSDT ANALYSISI have 4 positive signals.
If you hold this coin sell at the resistance line( $ 0,3758) and watch EngineeringRobo' s sell signal
It is ok to buy it but watch carefully EngineeringRobo' s sell signal.
Have a good trade If you want to use EngineeringRobo please dm me.

STXUSDT - Long - Potential 13.73%STXUSDT - Long - Potential 13.73%
Entry - 2681
TP1- 2886
TP2- 3049
SL- 2563
Please comment with thoughts and how you get on.
If you like the idea, then hit like on the idea & support with a follow.
Good luck out there!
STX Last Targets Hit New Target MappedReally important to me Please support my work by like or leave a comment
By "following" you can always get new information quickly.
"THANKS" you in advance for your support
..........................................................................................
As you can see Last targets hit and now price
could breaks below angle, new higher high recorded
which means uptrend continue
potential target mapped
GOOD LUCK


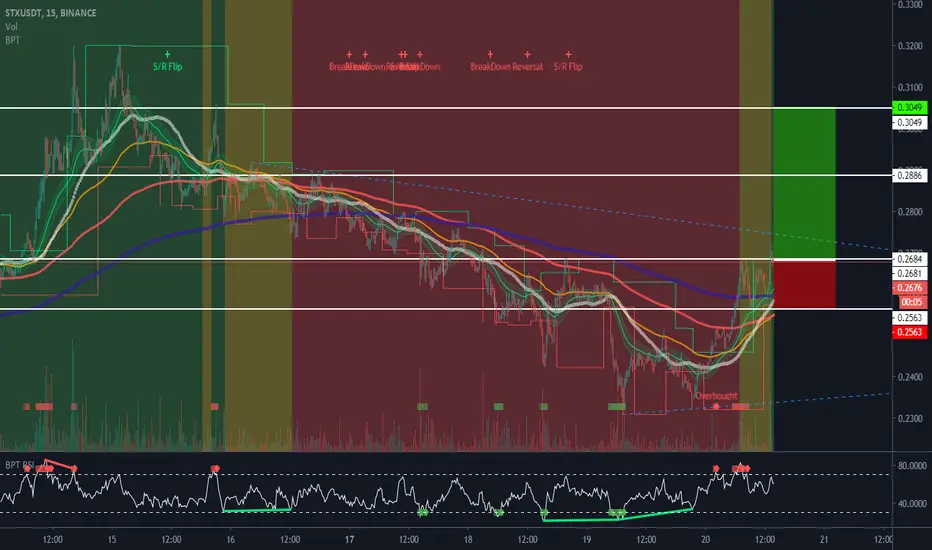
STX/USDT | Key Level | Support Cluster | Trade Setup Todays Analysis – STX/USDT – Retracing to establish an S/R flip re-test of daily support.
Points to consider:
- Healthy Up-trend
- Support Confluence (key level)
- Declining Volume
- Oscillators Below 50
STXUSDT needs to hold the re-test of the daily support zone to form a higher low on the chart and continue its bullish uptrend.
The Support cluster also coincides with the 200 EMA and .618 Fibonacci retracement, putting emphasis on the key level.
Volume is declining and below average, usually an indication of an influx being imminent; likely to coincide with the retest of support.
Both the RSI and stochastics are testing the 50 level, further price development will determine a directional bias. Oscillators need to range above 50 to maintain strength and momentum in the market.
Overall, in my opinion, a successful re-test of support validates a long trade to technical targets above with risk defined below local swing low.
If you’ve read this far - thank you for following my work!
And as always,
Focus on you, and the money will too!

