TradeCityPro | STX : A Healthy Uptrend with Promising Momentum👋 Welcome to TradeCity Pro!
In this analysis, I’ll review STX, the native token of the Stacks project, a prominent Layer 1 blockchain. The analysis focuses on the weekly timeframe.
⏳ Weekly Timeframe: A Healthy Uptrend
On the weekly chart, a strong uptrend has been in place since reaching the low of 0.201. Thus far, two bullish legs have propelled the price to 3.737, with the price currently testing the resistance at 2.471.
📊 Buying volume continues to increase, showing robust support for the ongoing trend with no signs of weakness. A visible ascending trendline has interacted with the price three times, further reinforcing the bullish momentum.
🔼 The 37.65 support level on the RSI is critical. As long as the RSI remains above this level, the probability of a bullish scenario outweighs the bearish one.
📈 If the price breaks above 3.737, it could move toward new all-time highs. In the event of such a breakout, I will update the analysis to include new targets.
🔽 Bearish Scenario
If the ascending trendline and the 1.264 support level are broken, the possibility of a trend reversal arises. In this case, the first major support level to watch would be 0.442.
📝 Final Thoughts
This analysis reflects our opinions and is not financial advice.
Share your thoughts in the comments, and don’t forget to share this analysis with your friends! ❤️
STXUSDT trade ideas

STXUSDT LONGIt is one of the currencies that has not grown in the market recently and is prone to good growth. It is moving in an ascending channel and has recently started its movement.

Are #STXUSDT Bulls Ready to Upheld the Bullish Momentum?Yello, Paradisers! Is #STXUSDT ready for a bullish breakout or will it fall? Let's discuss the latest analysis of #Stacks and see what's happening:
💎After months of grinding downward, #STX has finally reached a tipping point. The price is currently testing the upper boundary of a Descending Broadening Wedge, spurred by a solid rebound from the key support zone at $1.38–$1.51. But the big question is this: Can the bulls maintain this momentum, or are we looking at another fakeout?
💎#STXUSDT must conquer the critical resistance level at $2.28 for a true breakout. This area, which previously acted as strong support (tested twice), has now flipped into a stubborn barrier. Bulls will need a decisive move above this level, supported by increasing trading volume and the 20 EMA, to confirm the start of a genuine rally. If they succeed, the next target lies at the next major resistance zone, which could spark a significant upside move.
💎However, failing to sustain momentum could lead to a pullback toward the $1.38–$1.51 range, potentially retesting the breakout point. Losing this zone might open the door to further downside, with #Stacks slipping to the $1.05 demand zone.
💎The real danger begins if $1.05 fails to hold. A breakdown below this level would likely signal a shift in control back to the bears, leading to a deeper correction and extinguishing any short-term bullish hopes.
Stay focused, patient, and disciplined, Paradisers🥂
MyCryptoParadise
iFeel the success🌴

Alikze »» STX | Ascending channel🔍 Technical analysis: Ascending channel
- It is moving in an upward channel in the weekly and daily time frames.
- Within the ascending channel after a moving cycle, it has so far had good reactions to the tops and bottoms.
- In the short term, it has been moving in a descending channel, which is recorded in the golden zone of a reversal candle.
💎 Therefore, it can grow after the break of the descending channel, after the touch of the 2.42 range in the middle of the channel, after the pullback to the broken structure, the continuation of the upward path to the specified areas and then to the ceiling of the channel.
💎 In addition, if the golden zone and the bottom of the ascending channel are broken, the continuation of the ascending scenario will be invalid and should be reviewed and updated.
»»»«««»»»«««»»»«««
Please support this idea with a LIKE and COMMENT if you find it useful and Click "Follow" on our profile if you'd like these trade ideas delivered straight to your email in the future.
Thanks for your continued support.
Best Regards,❤️
Alikze.
»»»«««»»»«««»»»«««
BINANCE:STXUSDT

$STXusdt trading ideafollow the arrow for entry and exit. Based on waves it should pull back and start pumping.

STX (Stacks). Will follow when BTC stabilizes, BTC.D lowers STX (Stacks). Will follow when BTC stabilizes, BTC.D lowers
Using narrative play, + the lowering of BTC Dominance.
High conviction, high probability & strong narrative.
Targets from the Trend Based Fib Extension.

$STX Update - Respecting the upward curveFrom last post we saw a quick dip down to support zone and recovery back into the channel respecting the curve now pushing above $2.07 for an increase of 27%.


What Bitcoin does from now on, STACKS should do x3-x20 💳What Bitcoin does from now on, STACKS should do x3-x20 💳
Pyth Network announced its integration with Stacks, providing developers with low-latency oracles, according to an August 23 announcement.
Pyth Network, renowned for its finance-based pull oracle design, allows users to pull price data updates on-demand for a better optimized blockchain environment. Traditional oracles operate on a “push” mechanism, delivering data at set intervals, but through Pyth, “users are empowered to ‘pull’ price updates on-chain when needed, enabling everyone in that blockchain environment to access that data point.”
Stacks, acting as an important Bitcoin layer, allows the connection of decentralized apps and smart contracts with Bitcoin. Leveraging Bitcoin both as a transactional asset, it allows customers to use BTC to finalize transactions.
Developed by Hiro, a Bitcoin layer development company, this integration ensures that Stacks developers have a seamless avenue to over 300 price feeds, spanning equities, commodities, forex pairs, ETFs, digital assets and more.
Central to this collaboration is the enhanced data access for developers. With the integration, developers working on the Stacks platform can tap into Pyth Network’s real-time price data, extracting information from a comprehensive range of over 300 price feeds:
“This early access launch is intended for developers to test, explore, and begin integrating their decentralized applications with real-time price data.”
Leading platforms in this space, including ALEX, Arkadiko, Hermetica, and Zest, are already capitalizing on the integration, harnessing the power of Pyth’s oracles to empower their financial services. The infusion of reliable, real-time data is set to enhance the functionality, security, and user trust in these platforms.
As Stacks continues to carve its niche as an enabler of smart contracts and decentralized applications on Bitcoin, the integration with Pyth Network augments its ecosystem, providing developers with tools to craft more intricate and sophisticated applications.
Heralding the new collaboration, Marc Tillement, director of the Pyth Data Association, remarked on their dedication to provide developers with crucial tools. Similarly, Hiro’s CEO, Alex Miller, acknowledged the importance of this integration to the Bitcoin DeFi ecosystem:
“Bitcoin DeFi is thriving and Hiro is proud to be a part of bringing Pyth to the Stacks ecosystem to help provide developers with the building blocks they need like a powerful oracle.”
STACKS should do x3-x20 of whatever Bitcoin does from ow on 💳
STX is a Bitcoin layer for smart contracts
What Is Stacks (STX)?
Stacks is a Bitcoin Layer for smart contracts; it enables smart contracts and decentralized applications to use Bitcoin as an asset and settle transactions on the Bitcoin blockchain.
Bitcoin is the largest, most valuable, and most durable decentralized asset. The Stacks layer unlocks $500B in BTC capital using the Bitcoin L1 as settlement for decentralized applications.
Stacks has knowledge of the full Bitcoin state, thanks to its Proof of Transfer consensus and Clarity language, enabling it to read from Bitcoin at any time.
All transactions on the Stacks layer are automatically hashed and settled on the Bitcoin L1. Stacks blocks are secured by 100% Bitcoin hashpower. In order to re-order Stacks blocks/transactions, an attacker would have to reorg Bitcoin.
One Love,
The FXPROFESSOR💳

#STXUSDT (Watchlist) 11-2024🚀 STX/USDT - Inverted Head and Shoulders Setup 📊 – STX is forming an Inverted Head and Shoulders pattern, indicating a potential breakout to the upside. The price is currently near the right shoulder, and a breakout above the resistance at $3.887 could lead to a significant bullish move.
Current Price: $2.050
Support Levels:
$0.974 💠 (Support)
Resistance Levels:
$3.887 🔼 (Resistance)
$5.644 🔼 (Resistance)
$7.891 🔼 (Resistance)
Target Levels (TP):
$3.887 🟢 (TP1)
$4.500 🟢 (TP2)
$5.644 🟢 (TP3)
$7.891 🔼 (Resistance Target)
Note:
This is not financial advice but an analysis of coin movements. Conduct your own research and practice risk management before making any investment decisions. Remember, the cryptocurrency market carries significant volatility and risks.
Best wishes to all,
we ask Allah reconcile and repay. 🙏

STX trade ideaLong term analysis
This analysis is based on last year's trade entry analysis that you can read here .
BINANCE:STXUSDT is currently in the corrective wave IV of the last powerful bullish leg started around the beginning of 2023. It is also one of the rare coins which broke it ATH sooner this year, showing a very strong momentum.
The IV wave is finishing its stabilization within a clear triangle pattern (abcde) potentially coming to an end soon. The golden cross and flat bollinger bands replay a very similar situation than last year (see link above) offering us a new potential trade set up.
Strategy
Buy on the break of the resistance line at 2$
Objective 1: back to the next resistance at 2,40$ (+20%)
Objective 2: ATH at 4$ (+100%)
Objective 3: Fifth wave extension region around 8-10$ (+300-400%)
Invalidation
Mental Stop: below the last low of 1,60$
If prices retrace to this level we will wait for the weekly closing price then set a Stop loss ¼ or Risk below the weekly close price.

#STX/USDT / Ready to go up#STX
The price is moving in a descending channel on a 1-day frame and sticking to it well
We have a bounce from the lower limit of the descending channel, this support is at 1.46
We have a downtrend, the RSI indicator is about to break, which supports the rise
We have a trend to stabilize above the 100 moving average
Entry price 1.78
First target 2.00
Second target 2.23
Third target 2.50

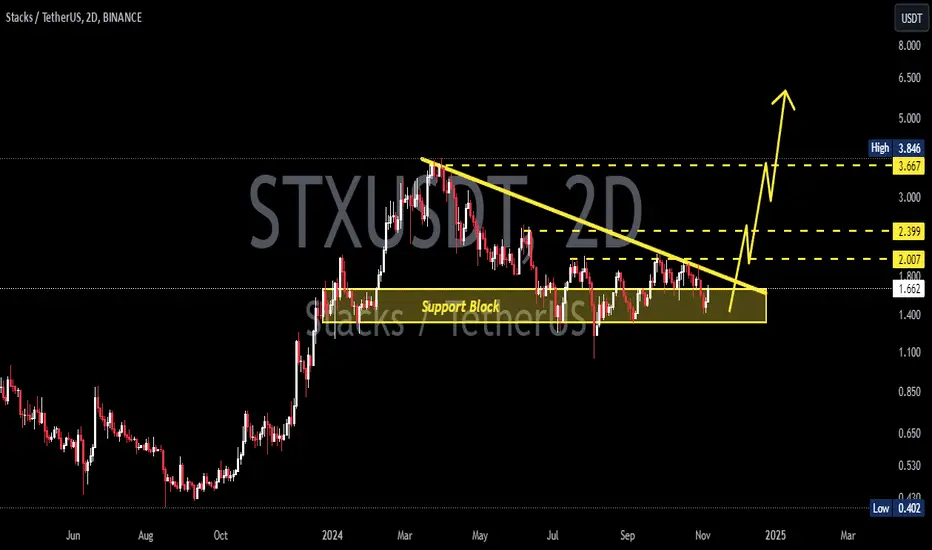
STXUSDTSTX ~ 2D
#STX So far it continues to maintain this support Block. Buy gradually on this support block,. with a minimum target of 15%++. If you have Conviction on this coin.
Potential Upward Movement in STX!Falling Wedge Pattern: This pattern, typically considered bullish, suggests a potential reversal to the upside. The fact that it's forming within an ascending parallel channel reinforces this bullish outlook.
On-Balance Volume (OBV) Divergence: While the price has been making higher highs and lower lows, the OBV is registering higher highs and higher lows. This positive divergence indicates that, despite price fluctuations, buying pressure is increasing, which often precedes a price uptick.
Relative Strength Index (RSI): Currently at 40, the RSI is approaching oversold territory. This suggests that the asset may be undervalued, potentially setting the stage for a price rebound.
Support Levels: The price is currently at the support level of both the parallel channel and the falling wedge pattern. These converging support levels can act as a strong foundation, increasing the likelihood of a price bounce.
Given these factors—the bullish falling wedge within an ascending channel, positive OBV divergence, RSI nearing oversold levels, and the presence of strong support—there's a technical basis to anticipate a potential upward movement in STX's price. However, it's essential to consider broader market conditions and conduct thorough research before making any investment decisions.

Stacks New Bearish Impulse: Volume SignalSTXUSDT (Stacks) did move lower in August and activated its December 2023 support range. It seems the bears (down-selling pressure) are not done with this pair.
The main level we have been tracking for the entire Cryptocurrency (Altcoins) market sits around September, October and November 2023, this is the main support for the current corrective period, the potential bottom. It seems Stacks will not be an exception and is ready to move lower, here shown with an orange line on the chart.
The blue line is the Dec. 2023 level. The orange line is for November 2023. Lower prices can be found around September/October 2023 but we are aiming for a higher low.
The signal that is pointing toward this disaster that is about to happen comes from the volume indicator. We can see the biggest volume bar since January 2024 on the daily timeframe, the highest volume in ten months happened yesterday.
When trading volume goes super high, it signals the start of a new move, a new impulse. Since yesterday was a bearish day, we lean towards a new bearish impulse; a lower low.
Thank you for reading.
Namaste.

Stacks | STX The price of Stacks is $0.79 today with a 24hour trading volume of 204 million dollar. This represents a 14% price increase in the last 24 hours and a 11% price increase in the past 7 days
Stacks is a crypto project on a mission to unlock the full potential of the Bitcoin network by bringing smart contracts and dApps to Bitcoin. It's designed as a Layer 1 solution that utilizes Bitcoin as its base layer. The Stacks token powers the performance of smart contracts, transaction processing, and registration of new cryptocurrencies.
as you can see the chart and candles still following the uptrend and are in green zone, the RSI are above average and volume goes up which shows bulls are in control
our today daily candle going to break 50 EMA line which is another bullish sign. bulls next targets are 0.83, 0.85 and 0.89. stop loss at 0.69 and 0.67 levels are necessary as well

STX Consolidation and Potential Rally AheadMarket Overview:
STX has been consolidating within a range established since June, currently testing potential resistance in the October 25th bearish gap ($1.701–$1.768).
Bulls are showing strength in this zone, hinting at the possibility of a rally, especially if traders begin "selling the news" following an upcoming release.
Key Levels to Watch:
Resistance Targets:
First target: Stops above the October 24th swing high at $1.842.
Next resistance: $1.884 (October 20th level).
Further resistance around relatively equal highs at $1.962, $2.000, and $2.074.
Support Levels:
Initial support: $1.652 (last week's candle tail midpoint).
If bearish pressure continues, further support may be tested near $1.560 and $1.530.
Potential profit-taking could occur around September 16th's swing low at $1.470.
Outlook:
A sustained bullish momentum could propel STX towards the upper resistance targets, supporting a continued rally.
Conversely, if bearish sentiment prevails, the price may test lower support levels, indicating a need for caution among traders.
#STX #CryptoMarket #Consolidation #BullishPotential #TechnicalAnalysis

DreamAnalysis | STXUSDT layer-2 blockchain for Bitcoin👋 Welcome back to DreamAnalysis! Today, we're diving into STX (Stacks), a unique layer-2 blockchain for Bitcoin, and analyzing its potential.
🔗 What is Stacks (STX)? Stacks (STX) is a layer-2 blockchain designed specifically to add smart contracts and decentralized applications (DApps) to the Bitcoin network. Smart contracts on Stacks run without altering Bitcoin's core structure, leveraging Bitcoin's security. The STX token is used for transactions and rewarding miners on the Stacks network.
📆 Weekly Analysis of STXUSDT:
In the weekly timeframe, STX shows a more bullish trend compared to many altcoins, which are sitting near their main support levels, while STX remains above these crucial levels.
A rising trendline on the weekly chart indicates that breaking and closing below 1.305 could lead to a decline toward 0.742. If that support breaks, consider temporarily exiting this coin in spot trades.
For re-entry, triggers at 1.987 and 2.444 offer good buying points to hold this Bitcoin layer-2 solution in a bull run. Increasing volume would strengthen this setup. Weekly STX Chart
📉 Daily Analysis of STXUSDT:
In the daily timeframe, STX is consolidating within the 1.65 to 1.987 range, and specific triggers are in place for the next move.
The weekly trendline also remains relevant here, and breaking below 1.65 could result in a drop toward the lower support level within a larger box range.
📊 4-Hour Analysis of STXUSDT: Market sentiment has shifted recently due to geopolitical events, including the Israel-Iran conflict, which has impacted many altcoins, causing widespread selling.
📈 Long Position:
wait for the trendline break and trigger confirmation at 1.82, considering higher timeframe bullishness.
📉 Short Position:
rejection from the trendline and breaking the significant 4-hour support at 1.649 could provide a favorable setup to enter short and follow the downtrend. 4-Hour STX Chart
💬 This wraps up today’s analysis. If you found this helpful, feel free to share it with friends, and drop a comment with any other pairs or coins you’d like us to analyze!
📌 Disclaimer: These analyses are based on chart patterns, not strict rules. Technical analysis is an art, and these insights are not financial advice.


#STX Set for a 133% Surge?In this daily chart of Stacks #STXUSDT, the price is forming a descending channel, a pattern often signaling a potential bullish reversal. Currently trading at $1.428, STX could rally to $3.345, representing a possible gain of 133.74%. With strong resistance levels being tested, this setup is drawing attention for a potential breakout. Are you ready for the ride?
⚠️ All trading ideas are published with a time delay. If you want to follow the trading in real-time, please follow the link:

STX Pumped From the trend lineBINANCE:STXUSDT is still moving in a ascending triangle, In my previous update i was expecting a breakdown of this triangle but fortunately Stx retest the trend line and made multiple Green Candles.
I have marked the Retest of this Trend line It is showing Clearly that after retesting this trend line STX is making a high, If the Bitcoin and Crypto market remain bullish Stx could hit the price may be 2$-2.3$.

STX breaking the trend line off ascending triangle NASDAQ:STX is currently breaking its trend as i mentioned in my previous analysis that ascending triangle is a bearish formation, lets see how down it will go, as per my analysis it will dump to 1.2$ minimum

STX is moving in Ascending triangle.is consolidating in ascending triangle, if the market remain bullish we may see a breakout from this triangle and it can lead the price of #STX to 3$.
But if it breakdown the triangle, it can also get dump 1$-1.2$.
