Sugar continue bearish but oversoldFOREXCOM:SUGAR Will continue go bearish but all indicators show that it is oversold. Waiting for the bullish monument and there will be a period of rolling back soon
SUGAR trade ideas

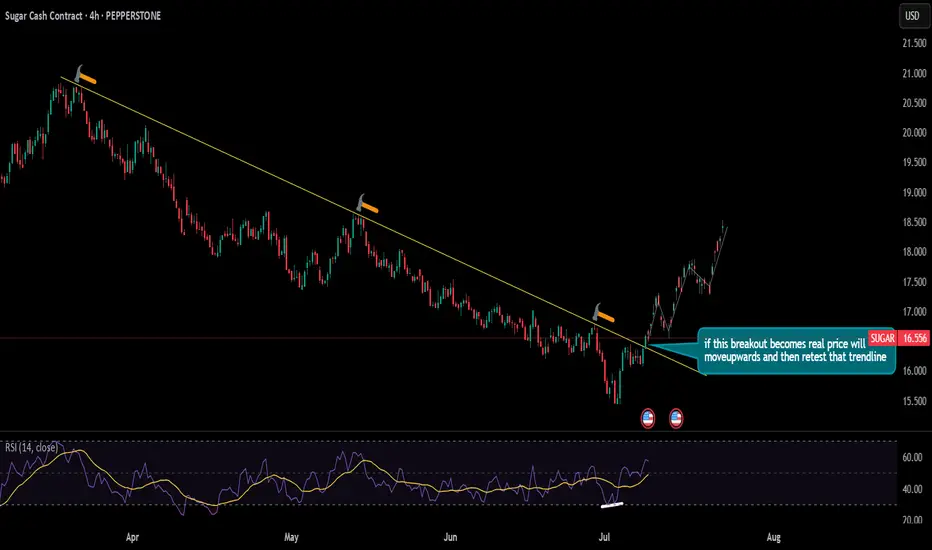
can we see price of SUGAR will increase in coming days??currently the price is breaking the trendline which was acting as strong resistance for some time. To confirm that this is reversal of trend we should and the price to retest that trendline which would be a major confluence of bullish trend
Sugar Is In A Higher Degree Correction; Elliott Wave AnalysisSugar has been trading lower since 2023 when we spotted final wave V of an impulse on the weekly chart. So from Elliott wave perspective, it’s trading in a multi-year higher degree ABC corrective decline, where wave C can drop the price even down to 78,6% Fibonnaci retracement and 14-12 support area before bulls show up again.
The reason why Sugar can go lower is a short-term daily Elliott wave structure, where we see a five-wave leading diagonal formation into wave A, followed by a bearish abcde triangle pattern in wave B. It can now extend the decline within wave C towards 14 -12 area which can be made by a lower-degree five-wave bearish cycle, just be aware of short-term pullbacks.

Sugar (CFD) – Bullish Setup from a Key Demand Zone! 🔥 Sugar (CFD) – Bullish Setup from a Key Demand Zone! 🍬
Sugar is bouncing off a major demand zone, presenting a great risk/reward setup for a bullish move. With technical indicators signaling a reversal and fundamental tailwinds supporting higher prices, this could be a great swing trade opportunity. Let’s dive into the setup!
💼 Trade Setup (CFD Pricing):
🔹 Entry Price: 1,770
🎯 Take Profit 1: 1,820
🎯 Take Profit 2: 1,930
🎯 Take Profit 3: 2,070
🎯 Take Profit 4: 2,350
🛡️ Stop Loss: 1,650
📈 Why Am I Bullish on Sugar?
1️⃣ Technical Reversal from a Strong Demand Zone
Sugar is bouncing off a key support level around 1,750-1,770, a demand zone that has held multiple times in the past. This level has consistently attracted buyers, and the current bounce suggests renewed interest from bulls.
Additionally, the RSI is climbing out of oversold territory, and Stochastic indicators are signaling a potential reversal, which supports a bullish outlook.
2️⃣ Fundamental Tailwinds
The global sugar market remains tight, with ongoing supply concerns in major producing countries like Brazil and India. At the same time, demand from China continues to rise, adding upward pressure on prices.
With weather risks and logistical issues, the supply/demand imbalance favors higher prices in the medium term.
💡 Final Thoughts:
Sugar is setting up for a strong bullish move, with both technical and fundamental factors aligning. If the price holds above the 1,750 demand zone, we could see a rally toward 2,000 and beyond.
Keep an eye on the 1,800 breakout level, which could confirm the continuation of the bullish trend. Let’s see how it plays out! 🚀
💬 What’s your take on Sugar? Are you bullish too? Drop your thoughts below! 👇

Sugar LongInto higher timeframe support on weekly chart.
The take profit is the moving average so will come lower over time.
Because trade is taken off a daily chart you will have to trail stop accordingly.

SUGAR Cash CFD Commodities Market Bullish Heist Plan🌟Hi! Hola! Ola! Bonjour! Hallo!🌟
Dear Money Makers & Thieves, 🤑 💰🐱👤
Based on 🔥Thief Trading style technical and fundamental analysis🔥, here is our master plan to heist the SUGAR Cash CFD Commodities Market market. Please adhere to the strategy I've outlined in the chart, which emphasizes long entry. Our aim is the high-risk Red Zone. Risky level, overbought market, consolidation, trend reversal, trap at the level where traders and bearish robbers are stronger. 🏆💸Be wealthy and safe trade.💪🏆🎉
Entry 📈 : "The heist is on! Wait for the breakout (19.60) then make your move - Bullish profits await!"
however I advise placing Buy Stop Orders above the breakout MA or Place Buy limit orders within a 15 or 30 minute timeframe. Entry from the most recent or closest low or high level should be in retest.
Stop Loss 🛑:
Thief SL placed at the recent / nearest low level Using the 4H timeframe (18.80) swing trade basis.
SL is based on your risk of the trade, lot size and how many multiple orders you have to take.
Target 🎯:
1st Target - 20.70 (or) Escape Before the Target
Final Target - 22.00 (or) Escape Before the Target
Scalpers, take note 👀 : only scalp on the Long side. If you have a lot of money, you can go straight away; if not, you can join swing traders and carry out the robbery plan. Use trailing SL to safeguard your money 💰.
📰🗞️Fundamental, Macro, COT, Sentimental Outlook:
SUGAR Cash CFD Commodities Market is currently experiencing a bullish trend,., driven by several key factors.
🌴 Fundamental Analysis
1. Supply and Demand: Global sugar production is expected to decrease due to adverse weather conditions in major producing countries.
2. Global Economic Trends: A potential global economic slowdown could decrease demand for sugar.
3. Weather and Climate: Adverse weather conditions, such as droughts and floods, can impact sugar production and prices.
🌴 Macroeconomic Trends
1. Inflation Rate: Rising inflation can lead to higher interest rates, affecting currency values and commodity prices.
2. GDP Growth Rate: A growing economy can increase demand for commodities, leading to higher prices.
3. Weather and Climate: Adverse weather conditions can impact sugar production, leading to price fluctuations.
🌴 Technical Analysis
1. Trend: The current trend is bullish, with sugar prices increasing by 10% in the last quarter.
2. Moving Averages: The 50-day moving average is above the 200-day moving average, indicating a bullish trend.
🌴 Market Sentiment
1. Investor Sentiment: Institutional investors are 40% bullish, 30% bearish, and 30% neutral on sugar.
2. Retail Sentiment: Retail investors are 50% bullish, 20% bearish, and 30% neutral on sugar.
3. Market Mood: The overall market mood is cautious, with investors waiting for further economic data before making investment decisions.
🌴 COT Report
1. Non-Commercial Traders: 35% long, 65% short
2. Commercial Traders: 40% long, 60% short
3. Non-Reportable Traders: 30% long, 70% short
🌴 Positioning
1. Institutional Traders: 40% bullish, 30% bearish, 30% neutral
2. Banks: 35% bullish, 35% bearish, 30% neutral
3. Hedge Funds: 42% bullish, 28% bearish, 30% neutral
4. Corporate Traders: 30% bullish, 40% bearish, 30% neutral
5. Retail Traders: 50% bullish, 20% bearish, 30% neutral
🌴 Price Prediction
Short-term Prediction (Next 30 Days)
- High: 20.50
- Low: 18.50
- Average: 19.50
Medium-term Prediction (Next 3 Months)
- High: 22.00
- Low: 18.00
- Average: 20.00
Long-term Prediction (Next 6 Months)
- High: 24.00
- Low: 17.00
- Average: 20.50
🌴 Overall Outlook
1. Bullish: Sugar prices are expected to increase due to decreasing global production and potential supply chain disruptions.
2. Volatility: Sugar prices are expected to be volatile, with potential price swings of 5-10% in the short-term.
⚠️Trading Alert : News Releases and Position Management 📰 🗞️ 🚫🚏
As a reminder, news releases can have a significant impact on market prices and volatility. To minimize potential losses and protect your running positions,
we recommend the following:
Avoid taking new trades during news releases
Use trailing stop-loss orders to protect your running positions and lock in profits
📌Please note that this is a general analysis and not personalized investment advice. It's essential to consider your own risk tolerance and market analysis before making any investment decisions.
📌Keep in mind that these factors can change rapidly, and it's essential to stay up-to-date with market developments and adjust your analysis accordingly.
💖Supporting our robbery plan will enable us to effortlessly make and steal money 💰💵 Tell your friends, Colleagues and family to follow, like, and share. Boost the strength of our robbery team. Every day in this market make money with ease by using the Thief Trading Style.🏆💪🤝❤️🎉🚀
I'll see you soon with another heist plan, so stay tuned 🤑🐱👤🤗🤩

Sugar Market: Higher U.S. Production and Global Trade ShiftsRising U.S. Sugar Production and Its Impact on Prices
In recent years, the United States has witnessed a notable increase in sugar production, driven by advancements in agricultural technology and favorable weather conditions. This growth has contributed to reduced reliance on imports, particularly from Mexico, which has traditionally been one of the largest suppliers of sugar to the U.S. market. While this development enhances domestic self-sufficiency, it also exerts downward pressure on both domestic and international sugar prices, reshaping global trade dynamics.
The shift in U.S. production patterns has significant implications for global markets. With increased domestic supply, the need for imports diminishes, impacting countries like Mexico that depend heavily on exports to the United States. This trend could lead to long-term adjustments in global trade flows, as other nations seek alternative buyers or adapt their own production strategies.
Challenges Facing Mexico's Sugar Industry
Mexico's sugar industry faces mounting challenges amid declining exports to the United States. In addition to competition from rising U.S. production, Mexican producers grapple with internal issues such as outdated infrastructure, water scarcity, and insufficient investment in modernization. These factors erode the competitiveness of Mexican sugar compared to its American counterpart, further complicating efforts to maintain market share.
Moreover, regulatory changes and evolving trade agreements add another layer of complexity. For instance, stricter quality standards and fluctuating quotas have created uncertainty for Mexican exporters, forcing them to explore new markets while addressing existing inefficiencies.
Changes in Import Patterns and Their Implications
Despite increased domestic production, the United States continues to import sugar to meet consumer demand. However, the composition of these imports is shifting. Data from USDA indicates that Mexico's share of U.S. sugar imports is decreasing, giving way to other major producers such as Brazil and Thailand, known for their cost advantages and flexible trading terms. This realignment reflects broader trends in global agriculture, where emerging economies leverage competitive pricing and scalable operations to capture larger portions of international markets.
For stakeholders in the U.S. sugar sector, understanding these shifts is critical. Companies must evaluate how changing import patterns affect supply chains, pricing strategies, and overall profitability. At the same time, policymakers face the challenge of balancing domestic interests with international obligations, ensuring fair competition without undermining local industries.
Looking Ahead
The evolving landscape of the global sugar market underscores the importance of adaptability and innovation. As the United States continues to boost its production capabilities, it sets a precedent for other countries to follow suit. Meanwhile, traditional exporters like Mexico must rethink their approaches to remain relevant in an increasingly dynamic environment. By embracing technological advancements, optimizing resource utilization, and exploring diversified markets, players across the sugar value chain can position themselves for sustained success in the years ahead.
ECONOMICS:WWSPI
OANDA:SUGARUSD
SET:KSL

Raw Sugar vs US Dollar Quote | Chart & Forecast SummaryKey Indicators On Trade Set Up In General
1. Push Set Up
2. Range Set up
3. Break & Retest Set Up
Notes On Session
Raw Sugar vs US Dollar Quote
- Double Formation
* (Reversal Argument)) At 23.500 USD | Subdivision 1
* Trendline 1&2 | Descending Triangle Measurement
- Triple Formation
* Pattern Confirmation | Inverted Head & Shoulders | Subdivision 2
* Numbered Retracement | Uptrend Bias & Entry | Subdivision 3
* Daily Time Frame | Trend Settings Condition
Active Sessions On Relevant Range & Elemented Probabilities;
European Session(Upwards) - US-Session(Downwards) - Asian Session(Ranging)
Conclusion | Trade Plan Execution & Risk Management On Demand;
Overall Consensus | Buy

SUGAR LONG A superb long opportunity has emerged with an outstanding risk-to-reward ratio. The price is forming a double bottom pattern, signaling a potential reversal to the upside.
To account for market fluctuations, we recommend placing the stop loss slighly lower than usual for added safety.
Good luck to everyone!

Sugar Up for a Potential RallySugar prices have reached a strong demand zone around 1825–1830, a major support level. The price action suggests potential accumulation, with buyers likely stepping in. A rebound could target the 1983 level as the next resistance.
A sustained breakout above 1983 could open the door for further upside momentum, while a failure to hold 1825 may signal increased bearish activity.
Follow up for results.

Sugar may target 22.7Daily chart, Sugar PEPPERSTONE:SUGAR can be seen as forming a diamond chart pattern.
Since there is a price gap, as shown in the circle, it may go to close this gap before a rebound to the resistance line R.
Above R, the target will be 22.7 passing through a resistance level at 20.9
Stop loss below 18.4 should be considered.

SUGAR - UniverseMetta - Signal#SUGAR - UniverseMetta - Signal
W1 - Potential start of the 5th wave in the continuation of the uptrend.
H4 - You can consider entering from these levels or wait for fixation beyond the trend line. A more confident entry point is formed at the formation of the 3rd wave. Stop behind the minimum of the 1st wave.
Entry: 2206.7 - *2246.5
TP: 2290.8 - 2378.3 - 2520.6 - 2609.5
Stop: 2143.4

Weekly CRT ON SUGAR - SELLIn this strategy I look at the last 3 W candles and the structure confirms my conditions for CRT (candle range theory) .
Conditions:
1. Candle 1 sweeps a high from the past.
2. Candle 2 sweeps liquidity from candle 1 and closes with body in first candle.
3. Key level - this happens in an bearish OB .
Enter at 22.720 (on candle 3 in W TF), when we sweep H4 liquidity, SL at candle 2 high, Tp1 in 50% of candle 1 range.

Will SUGAR Cup Reach Its Target?When the SUGAR 8-hour chart is examined; It is observed that the price movements continue within the Cup formation formation. It is evaluated that the SUGAR price may retreat to the level of 2077 in price movements below the level of 2278, but it is evaluated that in price movements above the level of 2278, it may exceed the level of 2412 and target the level of 2964.

Sugar Chart Review
When the daily chart of Sugar is examined; It is observed that the price movements continue on the downward sloping wedge. As long as the level of Sugar price 1.841 is not broken down, it is evaluated that in price movements above the level of 1.927, it can exceed the level of 2.024 and target the level of 2.287.

Sugar, will cookies be even cheaper?I am looking for a short position in a nice bearish engulfing on the weekly chart. PEPPERSTONE:SUGAR

SUGAR NO11 Short-term analysis of Sugar no11. Including 2 statistical charts showing the % monthly price changes over the last 5 years and a chart detailing the occurrence of consecutive positive and negative days "candles" and their frequency over 12 months.
- I expect more selling in July and then a rebound in August.
- Follow me on my socials for more detailed content

Sugar near a topBased on price action, sentiment and several indicators, a good SHORT opportunity is building here.
Sugar is in its 5th wave. ABC correction afterwards.
NFA.

NY SugarWhen the price started to stand in the orange square I was thinking of going long...but there is an important weekly resistance area ahead...the price on the daily time frame was able to change the bearish trend to the bullish trend...now the weekly resistance is ahead The price has continued to grow...but the good news for the bulls is that the price has not been able to break the daily support...not even close to it...I think the strength of the daily upward trend is high and it will take the weekly trend with it. slow...this week the daily uptrend was fighting with the weekly downtrend....I place my long order above the red line and wait.

Its time for a sugar rushSugar is respecting an important area, and after holding the support area of 19's I expect a travel to the 24 level. First stop at TP 1 21, TP 2 22 and TP3 24.
High risk-reward option for this trade.
Good luck

2 Scenario fot Sugar Dailydo now it came to retest the resistance and for me two scenario is waiting us

Sugar Bearish Trend The asset is in a downtrend, the weekly, daily, and 4-hour trends are in sync. I am waiting for the creation of a higher low to open a position.

Sugar | Buy the dipHello friend!
in my opinion there is a high probability that sugar will bounce up from this zone. chart is a little messy i know.
Good luck & DYOR!
