SUI - Double Digit is next - Alt season LeaderCorrection of the SUI is over, currently trading around the previous Support zone. i'm expecting this support to hold and bounce back from the support zone.
Once the price breaks from the falling wedge pattern we can expect the bullish momentum to start and hit new all time high.
Entry: after we
Key stats
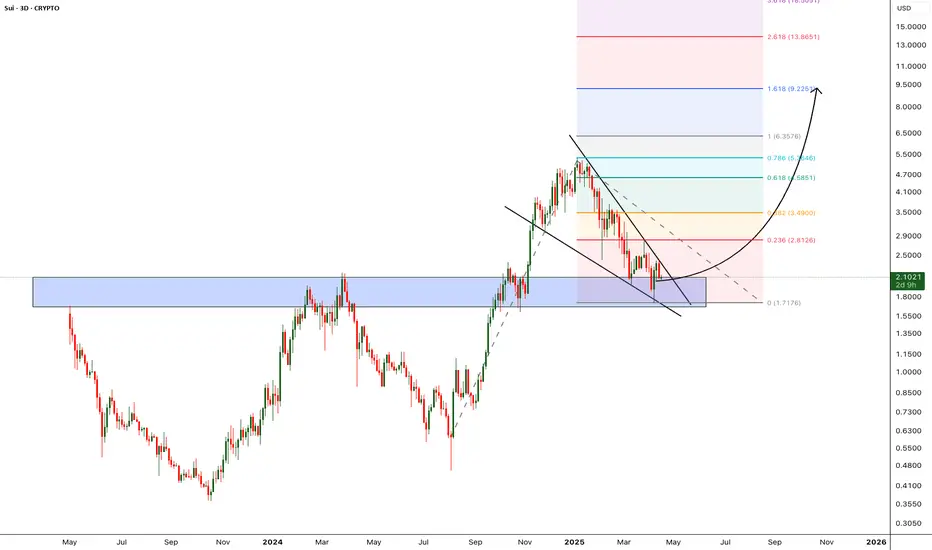
SUI: The Bullish Continuation#Sui led the market during the Aug–Dec 2024 rally. Since then, it has been in a corrective wave (4) within a larger bullish structure. A trend reversal might happen soon to target the ~$10 level.
Passing $3.57 confirms that, while breaking $1.71 would call for reassessment.

suiusdti believe we are not out of the woods yet, there are still a lot of uncertainty and still there will be one more drop

SUI: Toward All-Time Low?SUI broke the support at $1.97 and tested it once again from below with yesterday's brief countermovement. It should now proceed downward so that the turquoise corrective wave 2 can be properly completed. Subsequently, the turquoise impulse wave 3 should provide new upward momentum, racing toward n

Weekly plan for SUIIn this video I considered the global possible price movement, also made possible scenarios for the current week
Right now the price is between two important levels and there is a chance that the correction will start soon
Write a comment with your coins & hit the like button, and I will make an

SUI Trade Setup – Early Reversal PlaySUI has just swept underside liquidity around $1.80, reclaiming key support and showing signs of a potential trend reversal. If it holds this higher low and breaks above $2.40, that would likely confirm a bullish structure shift and open the door for a strong move up.
📍 Entry Zone:
Around $2.25
🎯

SUIUSDTSui Ranging Area none trading.
DISCLAIMER:
what I share here is just personal research, all based on my hobby and love of speculation intelligence.
The data I share does not come from financial advice.
Use controlled risk, not an invitation to buy and sell certain assets, because it all comes back

SUIUSD - Bearish Head and ShouldersA head and shoulders pattern that allows the creation of a slight up channel in blue
Circles in red show the head and shoulders pattern
Daily timeframe

SUI/USDT Price Action & Trade Setup – Key Support & Resistance LThis 1-hour chart of SUI/USDT showcases a significant price drop, with the price currently testing a key support level around $2.275. The highlighted red zone represents a resistance area near $2.345, while the blue zone indicates a potential downside target if the bearish momentum continues. The 20

SUI Gains Momentum Last 24hOn the 15m chart we are seeing a strong indicator of momentum growing as COINBASE:SUIUSD climbs above 2.6367 with strong buying action.
Up around 7% so far today, Sui is recovering from a slump during recent economic uncertainty and overall financial market volatility, but here we see in the las

See all ideas
Summarizing what the indicators are suggesting.
Oscillators
Neutral
SellBuy
Strong sellStrong buy
Strong sellSellNeutralBuyStrong buy
Oscillators
Neutral
SellBuy
Strong sellStrong buy
Strong sellSellNeutralBuyStrong buy
Summary
Neutral
SellBuy
Strong sellStrong buy
Strong sellSellNeutralBuyStrong buy
Summary
Neutral
SellBuy
Strong sellStrong buy
Strong sellSellNeutralBuyStrong buy
Summary
Neutral
SellBuy
Strong sellStrong buy
Strong sellSellNeutralBuyStrong buy
Moving Averages
Neutral
SellBuy
Strong sellStrong buy
Strong sellSellNeutralBuyStrong buy
Moving Averages
Neutral
SellBuy
Strong sellStrong buy
Strong sellSellNeutralBuyStrong buy