SUI new trend started!SUI / USDT
Price broke out after long accumulation range with good volume
Looks like a new bullish trend has started
Key stats
Trading activity
Transactions 751
BuysSells
336415
Volume 208.73 KUSD
Buys volumeSells volume
67.92 K140.8 K
Traders 248
BuyersSellers
138110
About SUIUSDC_5EB2DF.USD
Related DEX pairs

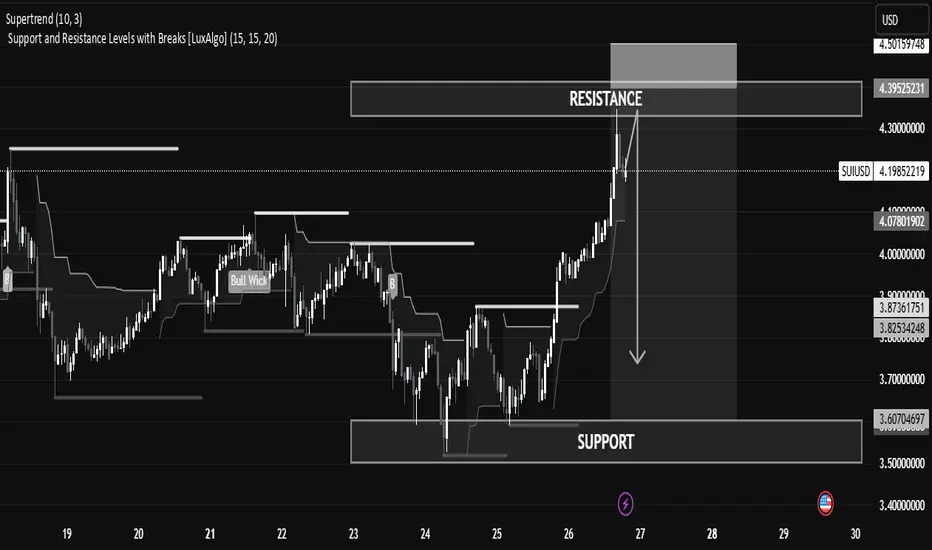
SUI/USD Technical Analysis – Potential Reversal Zone IdentifiedSUI/USD Technical Analysis – Potential Reversal Zone Identified
The current SUI/USD price action shows a strong bullish impulse reaching into a well-defined resistance zone, suggesting a potential pullback or reversal in the short term.
🔍 Key Levels
Resistance Zone: Between 4.30 – 4.39 USD, current
SUI — Structured Dip Buy Zone You Shouldn't IgnoreSUI has been technically clean, with well-respected Elliott Wave counts and fib levels.
As the broader market dips, it's time to look for sniper long entries and SUI is setting up beautifully for one around the $3.50 zone.
🧩 Key Confluence Zone: $3.50
This level offers a high-probability buy zo
SUI/USDT – Symmetrical Triangle Breakout in PlaySUI has officially broken out of a multi-month symmetrical triangle on strong momentum. This structure has been building since early 2024 and now looks ready for continuation.
Key Notes:
Breakout confirmed above trendline resistance with strong volume.
Reversal signals on the 1D and 4H timeframes a
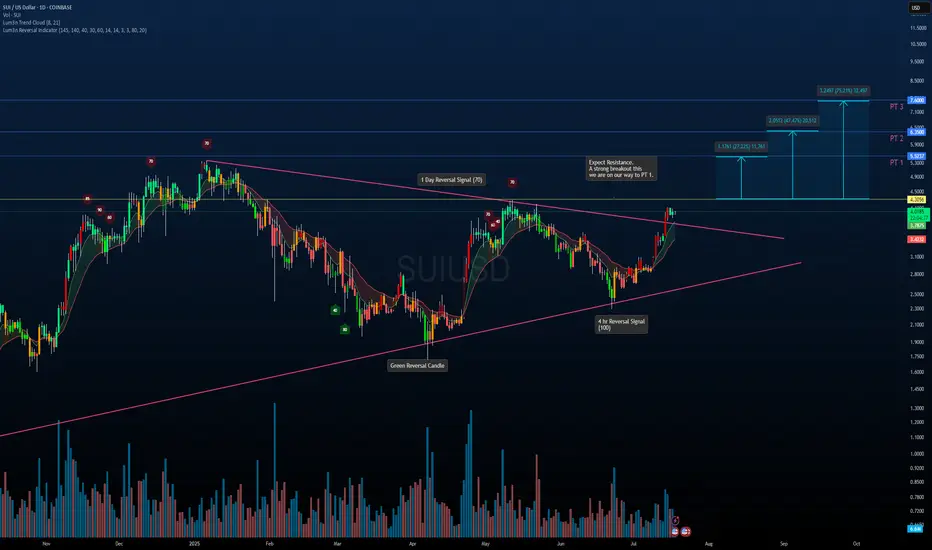
12R setup forming on SUITime to send it after that big channel retest? Clean 12R setup
Entry: 4.0
SL: 3.9
Target: 5.2

Sui targetsIn a bull market, the average retrace
ranges from .2 -.4 Fib (from the
bottom of that run).
Based on a confluence of factors, Sui may
drop to a minimum .4-.45 fib ($3.4-$3.5)

SUIUSD – Fib Zone or Fade?SUI failed a breakout at $4.05, reversed hard, and now trades near the 0.618 fib zone ($3.88). Price dipped as low as $3.82 before stabilizing. RSI curling from oversold (~30), indicating early recovery attempt. Structure still bearish unless bulls reclaim $3.96–$4.00. Risky but bounceable.
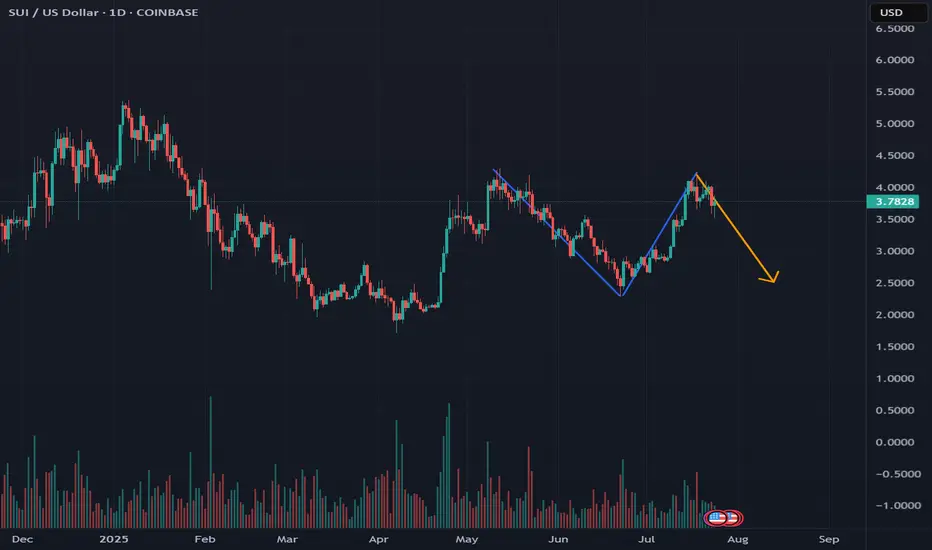
SUI Forms W or Butterfly Pattern: Potential Downward Move ExpectOn the global SUI CRYPTOCAP:SUI chart, a W or butterfly pattern is emerging, according to both patterns, the movement is likely to go down
The market is also returning to previous prices, but the liquidity gap has not yet formed on the dollar dominance chart, most likely another strait in the pri
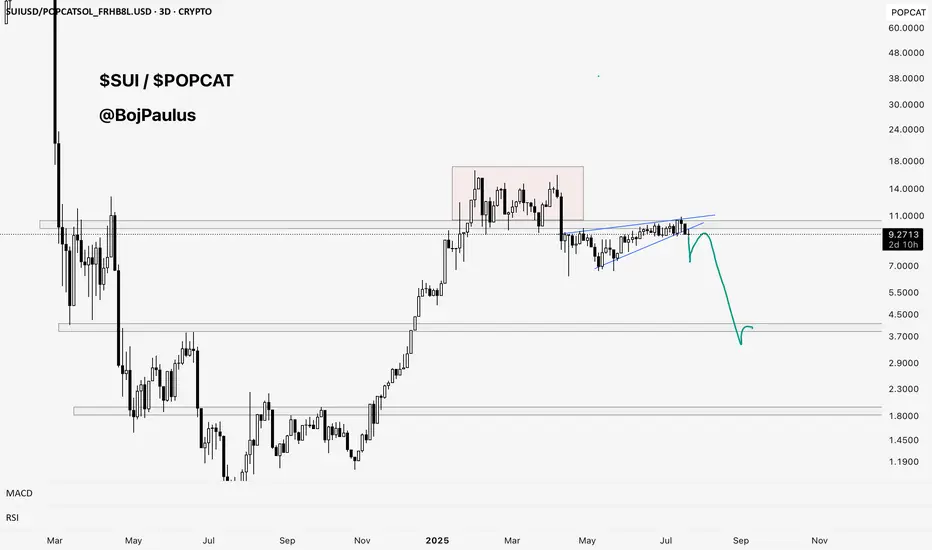
POPCAT is Cooking! Sui holders might want to look awayPOPCAT is cooking. SUI holders might want to look away. 🐱🍽️
A 2X outperformance is in the cards, potentially more.
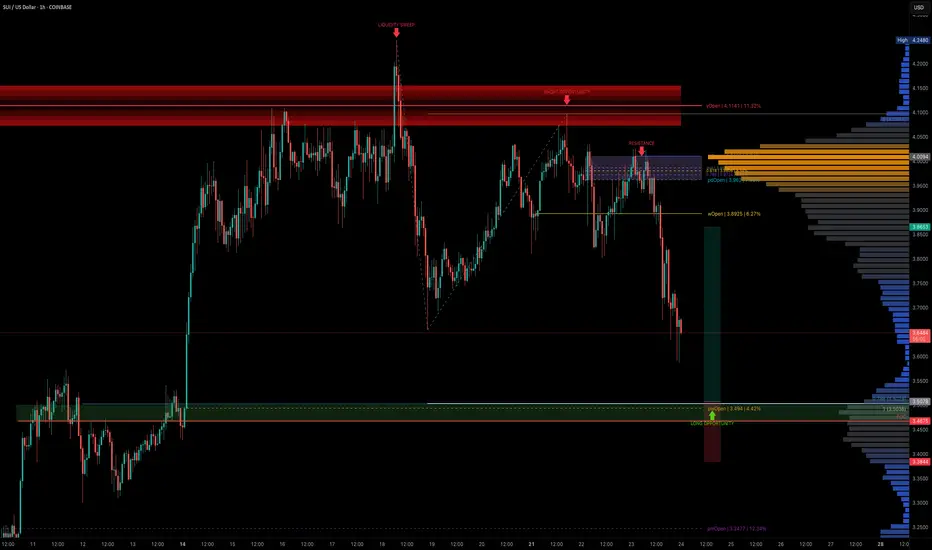
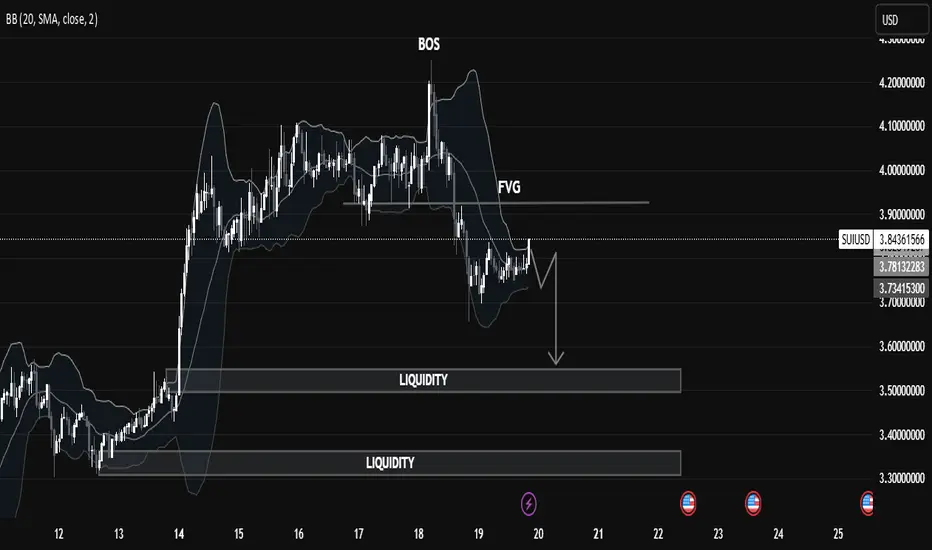
SUIUSD Liquidity Trap in Motion: Price Targeting Deeper Pools🧠 Market Structure Insight (SMC Framework)
🔍 1. Break of Structure (BOS):
The most recent BOS around the $3.95 level marked a bull trap, indicating a transition from bullish momentum to a distribution phase. This suggests institutional players offloaded liquidity at premium prices before initiating
See all ideas
Summarizing what the indicators are suggesting.
Oscillators
Neutral
SellBuy
Strong sellStrong buy
Strong sellSellNeutralBuyStrong buy
Oscillators
Neutral
SellBuy
Strong sellStrong buy
Strong sellSellNeutralBuyStrong buy
Summary
Neutral
SellBuy
Strong sellStrong buy
Strong sellSellNeutralBuyStrong buy
Summary
Neutral
SellBuy
Strong sellStrong buy
Strong sellSellNeutralBuyStrong buy
Summary
Neutral
SellBuy
Strong sellStrong buy
Strong sellSellNeutralBuyStrong buy
Moving Averages
Neutral
SellBuy
Strong sellStrong buy
Strong sellSellNeutralBuyStrong buy
Moving Averages
Neutral
SellBuy
Strong sellStrong buy
Strong sellSellNeutralBuyStrong buy