SUI update: Targeting the ATH#SUI has seen significant growth since its April low, passing the bullish confirmation level and forming a clear motive wave, followed by a correction.
As long as it holds above $1.71, this setup remains valid with potential for a new all-time high soon.
#SuiNetwork
SUIUSDC_77F786.USD trade ideas

SUI: Buy and hold till 2028?I am planning on buying and holding for now. SUI probably has the best chart among all altcoins at the moment. Beautiful higher highs and higher lows with perfect 45 degree angle and textbook Elliott wave look; it can't get any better. I started to buy last year and loaded up again during the recent correction and will plan on adding on every dip. Stop loss at the last low around $1.7 and it will move up as we see new higher lows. Fundamentally it seems to have everything going for it. It is fast and trying to be decentralized as a core feature. But similar to Solana, it needs to figure out how to minimize outages and exploits and hopefully will make the necessary changes soon to truly compete against ETH, SOL and ADA. As a new generation layer 1, it holds a lot of promise, so I will be in it for a while unless it proves itself otherwise.

SUI Swing Trade Setup Targeting 2R Risk-RewardSUI Likely to Close Daily Above $4.12 — Setting Up for Next Leg Toward All-Time High of $5.40
SUI is showing strong momentum and is likely to close the daily candle above $4.12, potentially setting up for the next leg up toward its all-time high at $5.40.
This swing trade setup offers a 2:1 risk-to-reward ratio:
Entry: $4.15
Stop Loss: $3.56
Target: $5.40
This analysis is for educational purposes only. Always manage risk appropriately — consider risking no more than 1% of your portfolio.

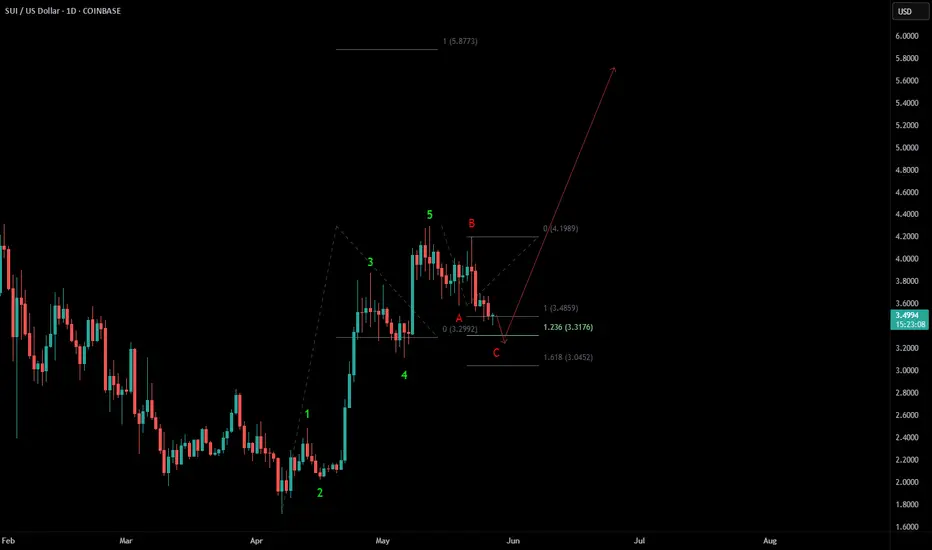
Bullish sequence in SUIUSD Since 4.07.2025 low, SUIUSD is showing the 5 swing bounce, which indicates that it will extend higher, once the pullback ends in 3, 7 or 11 swings pullback. Short term, it favors 3 swing pullback in A-B-C between 3.4859 - 3.0452 area before it resume higher. Further upside above 5.12.2025 will confirm the rally towards 5.85 or higher levels. But it and do double correction, if fail to break above 5.12.2025 high after ending the current pullback.
SUI — Breakout or Breakdown? Long & Short SetupsSUI has been trapped in a trading range for the past 6 days, consolidating between key levels and building up liquidity for the next big move. When price goes quiet like this after an impulsive structure, it’s not time to trade—it’s time to observe, analyse, and prepare.
So, where’s the next high-probability setup?
Let’s break it down:
🔹 Elliott Wave Context
From my previous SUI analysis, I identified a completed 5-wave impulse structure. After such a move, a corrective ABC pattern is typically next.
SUI has been respecting technical levels with surprising accuracy throughout this cycle—especially Fibonacci levels and key horizontal zones.
📉 ABC Correction in Progress?
Wave A appears to be completed, and Wave B was rejected at the yearly level in perfect confluence with the golden pocket (0.618–0.666) retracement of Wave A. This strongly suggests that Wave C is now unfolding.
Using the 1:1 trend-based Fib extension, the projected Wave C target lands at:
➡️ $3.6413
Let’s dig deeper—does this level hold up under further scrutiny?
🔍 Multi-Layered Confluence at $3.56–$3.64
Here’s what aligns at this potential support zone:
1:1 Fib extension (Wave A = Wave C) → $3.6413
0.55 Fib retracement (from $3.1132 to $4.2967) → ~$3.64
Volume Profile POC from prior range → ~$3.59
0.618 Fib retracement → $3.5653
Weekly level → $3.5594
21-Day EMA → $3.5537
21-Day SMA → $3.6319
0.75 Fib Speed Fan (if hit on May 16) → aligns with zone
This stack of levels gives us a tightly packed, high-conviction support area between:
📍 $3.56 – $3.646
___________________________________
🟢 Long Setup Idea:
Entry Zone: Ladder entries between $3.56 and $3.75
Stop-Loss: $3.4546 (beneath confluence zone)
Take-Profit Target: $4.588 (0.786 Fib retracement + -0.236 Fib extension)
R:R: ~5:1
🚫 Invalidation: If SUI reclaims the yearly level at $4.1152 before revisiting this support, the setup is invalidated.
🔴 Short Setup Idea:
If SUI pushes into the 0.786 Fib retracement at $4.588 and shows clear rejection (e.g., SFP, bearish engulfing, high-volume reversal), a short can be considered.
Entry: On rejection at $4.588
Stop-Loss: ~$4.714
Targets:
TP1: $4.325 (recent highs)
TP2: $4.1152 (yearly level)
🧠 Final Thoughts:
This is where trading becomes a game of patience. I’ve mapped both long and short setups based on structure, confluence, and price behaviour. Now it’s about waiting for price to come to your levels.
⏰ Alarms set.
📈 Let the chart do the work.
More updates to come as the range resolves. Stay sharp!
___________________________________
If you found this helpful, leave a like and comment below! Got requests for the next technical analysis? Let me know.


SUIUSDTset up LONG trade 📈
🚨🚨🚨Disclaimer on Money Management for Trading in the Futures
📝 MarketFutures trading carries high risks and may result in the loss of your entire capital. Only use funds you can afford to lose, set risk limits, and understand the market and leverage. Diversification does not guarantee profits. Consult a financial advisor before trading. All decisions and losses are your sole responsibility.

SUI long 34% short 88%I think we need to see these moves first before we will have the extreme big wave to the upside. Just opened a long position. Then looking to short

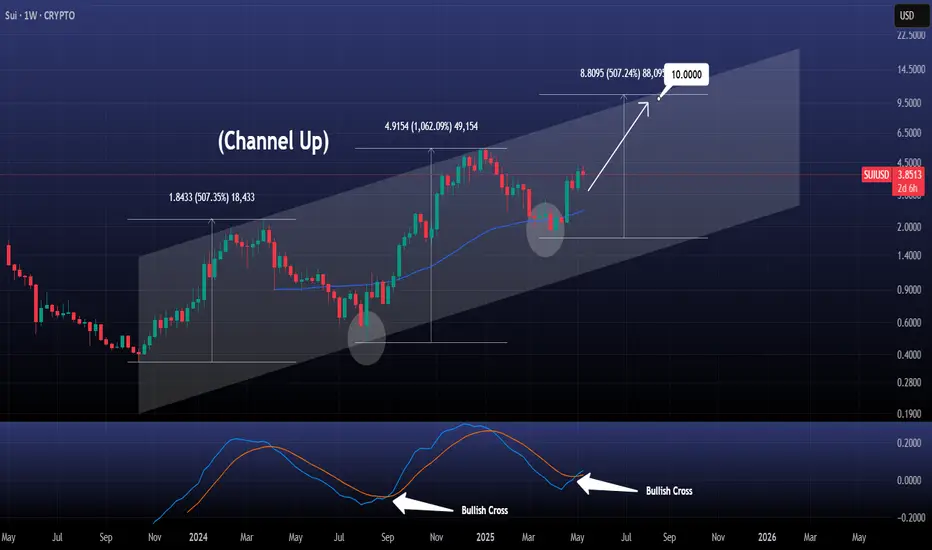
SUIUSD Massive Bullish Cross was just completed!SUI just made a Bullish Cross on the 1W timeframe, its 2nd ever.
The first one was on September 2nd 2024, 4 weeks after the price bottomed on the long term Channel Up and rebounded.
The latest Cross was also formed 4 weeks after the April 7th 2025 bottom and even though we don't expect a similar +1062% rise, we do expect the growth that the first Bullish Leg had (+507.35%).
Target $10.000 right at the top of the Channel Up.
Follow us, like the idea and leave a comment below!!
$SUI Token Unlocks for next 5 years Confirmed Lower HighConfirmed lower high.
Possible down trend over time
due to unlocks and sale pressure it will cause.
Maybe the youtubers can shill it to pump at each lower low it prints.

SUI SHORT Short term SUI Scalp. Broke minor support and should continue down momentarily before a push up before the main short after a liquidity grab.

Weekly trading plan for SUIIn this idea I marked the important levels for this week and considered a few scenarios of price performance
I forgot to mention, but if the price can consolidate above the Pivot point after the correction, we may see further growth with the local top update
Write a comment with your coins & hit the like button and I will make an analysis for you
The author's opinion may differ from yours,
Consider your risks.
Wish you successful trades ! mura

Sui broke above the wedge & is already over halfway 2 the targetSUUSD has had a very notable pump on this uptrend which hopefully will end up being the beginning of confirming a real sustained uptrend in the alt market. *not financial advice*

Long-Term Analysis of SUII've used multiple timeframes — from 15-minute to 4-hour, 1-day, and 1-week charts — to create a comprehensive technical analysis. Based on my observations, there's a high probability that SUI is forming a “castle” structure (likely referring to a complex correction or distribution phase), but I don't expect it to reach the top of the previous high. The presence of large candles and significant gaps in the past suggests that the move was driven by momentum rather than sustainable trend, and such impulsive moves usually don't last long.
I've identified the key order blocks and marked the FVGs (Fair Value Gaps) for you. Elliott Wave structures are also drawn. I even placed a sample order for beginners or those who don't want to spend too much time analyzing.
In summary, we're currently in an Elliott Wave correction phase.
That's it for now — I’m tired and heading for my afternoon nap.
پ

SUIUSD: Enormous rally started, targeting $10Sui just turned overbought on its 1D technical outlook (RSI = 70.835, MACD = 0.285, ADX = 33.014) but doesn't seem to even take a breather here as it rebounded on its 1D MA200, establishing it as its new long term Support. The underlying pattern of this Bull Cycle is a Channel Up and technically the market has started its new bullish wave. A +500% rise from the bottom (which was accomplished on both prior bullish waves) suggests a long term TP = $10.000.
See how our prior idea has worked out:
## If you like our free content follow our profile to get more daily ideas. ##
## Comments and likes are greatly appreciated. ##

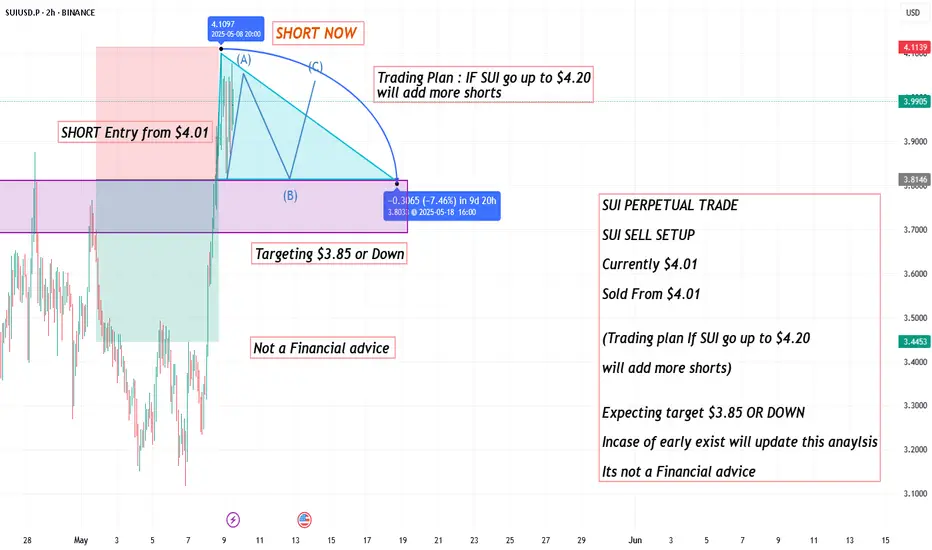
SUI PERPETUAL TRADE ,Sold From $4.01SUI PERPETUAL TRADE
SUI SELL SETUP
Currently $4.01
Sold From $4.01
(Trading plan If SUI go up to $4.20
will add more shorts)
Expecting target $3.85 OR DOWN
Incase of early exist will update this anaylsis
Its not a Financial advice
SUIWill this move end up neing sustained has got to be the question everyone is asking? It does appear the SUI is in 2025 what SOL was to the market in 2021. I see us entering into SUIs 5th leg of an elliott wave setup. Excited to see what happens next in the overall market. These next few months could be start of an actual BULL MARKET.

SUI Going to 4.80?Hi everyone
Here is my weekly analysis on SUI, it appears we are heading to 4.80-5.20 levels before we see another correction, lets see how we go
Kris/Mindbloome Exchange
Trade Smarter Live Better

Will the growth of SUI continue ?In this idea I marked the important levels for this week and considered a few scenarios of price performance
Locally, the price is in the correction phase and the main reversal can be expected from the zone $2.7-$2.8
Write a comment with your coins & hit the like button and I will make an analysis for you
The author's opinion may differ from yours,
Consider your risks.
Wish you successful trades ! mura

SUI PERPETUAL TRADE, Sold From $3.45SUI PERPETUAL TRADE
SUI SELL SETUP
Currently $3.45
Sold From $3.45
(Trading plan If SUI go up to $3.60
will add more shorts)
Expecting target $3.34 OR DOWN
Incase of early exist will update this anaylsis
Its not a Financial advice

SUI - A closer lookIn my previous SUI analysis, I currently have us in an impulse structure leading into the 5th wave.
Zoomed out, it seems we're still in a corrective structure. Looking to short at the TP of the long.

SUIETH bull 3-6 monthsSUIETH bull 3-6 months bull signal based on fundamentals and cyclicality of refinancing debt in the world

SUIUSD is consolidating ahead of massive Leg. Can it hit $9.500?Sui (SUIUSD) has completed Stage 1 of its recovery process following the April 07 bottom. That was a Higher Low on the 2-year Fibonacci Channel Up and having already broken above both the 1D MA50 (blue trend-line) and 1D MA200 (orange trend-line), the price is now consolidating.
This is fairly similar to what it did on September 20 2024, which was followed by a strong rise to the 1.0 Fib (previous High) where the price pulled-back to the 1D MA50. That was its final test before the peak forming rally just above the 1.5 Fibonacci extension.
As a result, we expect SUI to hit at least $9.500 on the long-term.
-------------------------------------------------------------------------------
** Please LIKE 👍, FOLLOW ✅, SHARE 🙌 and COMMENT ✍ if you enjoy this idea! Also share your ideas and charts in the comments section below! This is best way to keep it relevant, support us, keep the content here free and allow the idea to reach as many people as possible. **
-------------------------------------------------------------------------------
💸💸💸💸💸💸
👇 👇 👇 👇 👇 👇
