Lingrid | SUIUSDT Pullback Setup: Expansion Trade OpportunityBINANCE:SUIUSDT is forming a bullish continuation structure within an upward channel, with the price pulling back after reaching a recent peak. Current support is found around 2.885, aligned with the upward trendline and prior breakout zone. If the price rebounds from this cluster, it may target th

Will SUI show further correction?SUI Price Update
SUI has been in a downtrend since May 2025 and appears to have more room for correction. It is likely to drop to around $2, so exercise caution with any long trades. If it does reach that level, it could present a good opportunity for accumulation.
Strategy:
~ Accumulation Range:

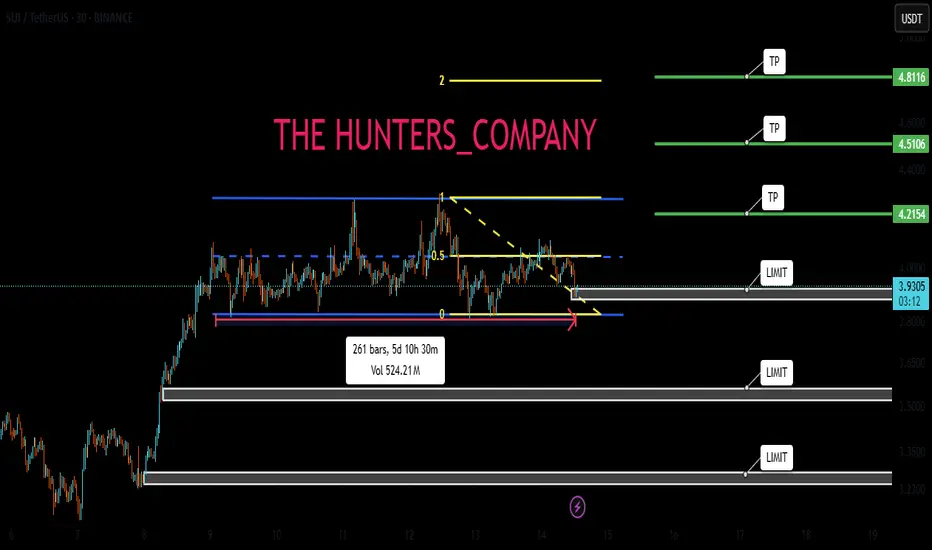
Sui update hello friends👋
✅️Considering the drop we had, now the price has reached an important and good support and the price has been supported by the buyers and the downward trend line has broken and the ceiling has been raised. Considering this, it was possible to enter into the transaction with capital a

$SUI Swing Trade Setup – Breakout Confirmation & R/R Plan📌 Analysis Summary:
SUI has broken out of a strong falling channel structure that started in late May.
We’re now seeing a bullish breakout + retest, suggesting a potential trend reversal from bearish to bullish.
A small consolidation zone near the breakout confirms strength, supported by buyer pres

SUIUSDT Forming Falling WedgeSUIUSDT is currently showing a very strong bullish technical setup as it forms a classic falling wedge pattern, which is widely known in crypto trading for its high probability of signaling a reversal to the upside. The pattern, combined with increasing volume, is suggesting that buyers are stepping

$SUI/USDT Technical Analysis
Major Bounce from FIBO ZONE 📈
SUI has just bounced off the golden Fibonacci retracement zone (0.618–0.786), confirming it as strong dynamic support. This move comes after a healthy correction from previous highs.
📍 Current Price: $3.0816
🎯 Target 1: $4.8865
🎯 Target 2: $7.4445
🛡 Invalidation L

$SUI is showing strength again. It's bouncing from a strong support zone and respecting the upward trendline, signs that buyers are stepping in.
If it reclaims the $3 level, we could see a solid move toward $5.78.
Looks like the Bulls are warming up.
DYOR, NFA.
#SUI #Suiusdt

ouchDidn’t Work out as I expected, so took a loss, it’s ok, live to fight another day. These post are my journal and tracking progress

Will suffering be broken today?Hello friends
Given the good price rise, you can see that the price has entered a range, which indicates that it is gathering strength for its next move.
Now we can buy in steps with risk and capital management and move with it to the specified targets.
*Trade safely with us*

See all ideas
Summarizing what the indicators are suggesting.
Oscillators
Neutral
SellBuy
Strong sellStrong buy
Strong sellSellNeutralBuyStrong buy
Oscillators
Neutral
SellBuy
Strong sellStrong buy
Strong sellSellNeutralBuyStrong buy
Summary
Neutral
SellBuy
Strong sellStrong buy
Strong sellSellNeutralBuyStrong buy
Summary
Neutral
SellBuy
Strong sellStrong buy
Strong sellSellNeutralBuyStrong buy
Summary
Neutral
SellBuy
Strong sellStrong buy
Strong sellSellNeutralBuyStrong buy
Moving Averages
Neutral
SellBuy
Strong sellStrong buy
Strong sellSellNeutralBuyStrong buy
Moving Averages
Neutral
SellBuy
Strong sellStrong buy
Strong sellSellNeutralBuyStrong buy
Displays a symbol's price movements over previous years to identify recurring trends.