SUIUSDT.PS trade ideas

Sui (SUI): Might Be Selling Opportunity (If all goes by plan)Sui coin had a good MSB with recent news about trade deals by Trump. Now that we filled the FVGs, we are going to look for weakness to kick in, which would give us the final confirmation in the form of BOS and then we can see further movement to lower zones from here.
Swallow Academy

Lingrid | SUIUSDT Pullback Setup: Expansion Trade OpportunityBINANCE:SUIUSDT is forming a bullish continuation structure within an upward channel, with the price pulling back after reaching a recent peak. Current support is found around 2.885, aligned with the upward trendline and prior breakout zone. If the price rebounds from this cluster, it may target the upper resistance near 3.20.
📈 Key Levels
Buy zone: 2.85–2.89 (support + trendline confluence)
Sell trigger: break and close below 2.85
Target: 3.20 within the upper boundary of the resistance zone
Buy trigger: bullish bounce from trendline and higher low confirmation
💡 Risks
Failure to hold above 2.88 support may invalidate the upward bias
Price volatility near trendline could trap early buyers
Rejection from 3.20 might trigger sharp retracement back to 2.70
If this idea resonates with you or you have your own opinion, traders, hit the comments. I’m excited to read your thoughts!

DeGRAM | SUIUSD got out of the channel📊 Technical Analysis
● Price pierced the four-week falling-channel roof and the apex of a contracting triangle, turning 2.88 support into a launchpad and carving a sequence of higher lows.
● Breakout measured move and channel mid-band converge at 3.15; a close above there exposes the next horizontal barrier and channel top at 3.46. Risk is framed by the former triangle base at 2.88 and major swing floor 2.69.
💡 Fundamental Analysis
● Sui’s on-chain TVL has climbed >15 % since 25 Jun after zkLogin main-net rollout and Mysten Labs’ new developer grants, underpinning demand despite broad market lethargy.
✨ Summary
Long 2.90-3.05; hold above 3.15 targets 3.46. Invalidate on a 4 h close below 2.88.
-------------------
Share your opinion in the comments and support the idea with a like. Thanks for your support!

Sui: Bullish Potential w Leverage, Between 4-8X (PP: 720%-1440%)Sui looks great right now. This is a pair that I am approaching with leverage considering only a relatively small range, a 180% target. When multiplied by your number of leverage you can get an idea of the total profits potential. For example, 8X would be equal to 1440% while 4X gives 720%.
Technical analysis
How do we know the correction is over? We don't. We never do, but we always make an educated guess.
The higher low found support at 0.786 Fib. retracement relative to the initial breakout. Support is always found at one of these fib. levels with the 0.786 being the lowest on a bullish bias. When prices go as low as 0.786 a resumption of the bullish move is high probability. This can always be supported by additional signals of course.
Additional signals
Bitcoin is strongly bullish above $106,000 on a daily basis. The altcoins market tends to grow when Bitcoin consolidates at high prices.
The altcoins that moved first all remain bullish rather than producing a major crash. This means that the bullish cycle is on or else those that move strongly revert as soon as resistance is found. When a pair finds resistance and after a few days continues to challenge it, this is super bullish. This is what I am seeing on the pairs that I am tracking, and we are only concerned with the pairs we track because there are thousands of trading pairs and everything is always possible. Opportunities are endless.
Drawings vs numbers
The drawings and technical analysis are for learning and entertainment. The numbers, chart setup, entry and timing are the opportunity.
You can use one, you can use both. Whatever you do, is up to you.
Please keep in mind that there is always risk involved, especially when using leverage.
Do your own research and planning. Accept your mistakes, learn from these mistakes and success is guaranteed. When life hits you hard, stand up and try again. These are only lessons that will help us improve our game.
Challenges build resilience and character. Bring them all...
I am ready for battle, I am ready for profits, I am ready for success.
Thank you for reading.
Namaste.

ouchDidn’t Work out as I expected, so took a loss, it’s ok, live to fight another day. These post are my journal and tracking progress

$SUI Breakout Alert, Is the Move Just Getting Started?CRYPTOCAP:SUI , after accumulating for a while in LTF, broke through, it looks good here.
Long at CMP, add more up to $2.84 with a stop loss of $2.69.
I will be posting more potential trade setups soon.
Stay tuned and follow for more.
DYOR, NFA.

$SUI is still moving inside a falling channel!!CRYPTOCAP:SUI is still moving inside a falling channel on the 12H chart.
The price is near the bottom of the channel and starting to slow down.
If it breaks out from here, it could move up toward $4, that’s around 50% higher.
No breakout yet, but the setup looks interesting.
DYOR, NFA

Sui update hello friends👋
✅️Considering the drop we had, now the price has reached an important and good support and the price has been supported by the buyers and the downward trend line has broken and the ceiling has been raised. Considering this, it was possible to enter into the transaction with capital and risk management and move to the specified goals with it.
🔥Join us for more signals🔥
*Trade safely with us*

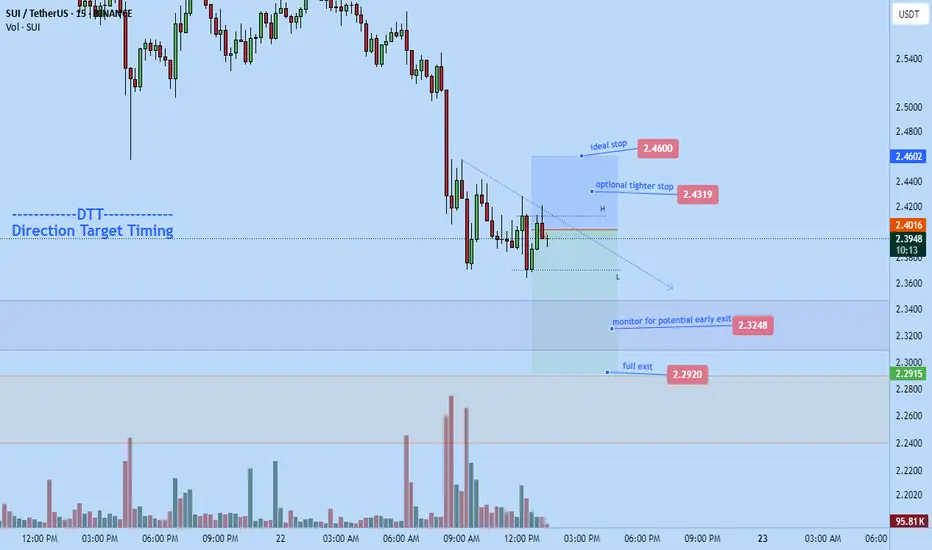
Sui short to $2.2920Went short on sui a while ago. I think the market is likely to push down a bit more before we have any major corrective move based on my DTT analysis
Stop: $2.46 for better invalidation
Tp $2.2920
potential early close at $2.3248
Time sensitive
Sui (SUI): Possible Pump Incoming | Bullish TrendSui coin is having smaller correctional movement while still holding bullish momentum inside the trend. Just like on 25th of October we are seeing correctional movement, which might turn into a big bullish movement so we are keeping eyes on EMAs and as long as we are above them, we are keeping that bullish sentiment
Swallow Academy

SUI SHORTSUI broke through an ascending trendline. The decline to a support level at 2.26$ is expetced to happen

SUI | — Key Buy Trigger AheadPrice is drifting lower and approaching a high-confluence retracement zone. A key bullish setup may form if price sweeps the 0.618–0.666 Fibonacci region and reclaims the level with strength.
📌 Buy Trigger:
• Sweep into the $2.38–2.5 zone
• Look for reclaim and bullish reversal for long entry
• Structure remains constructive while above monthly support ($1.91)
📈 Reclaim Level for Strength:
• $2.83 — clearing this confirms bullish intent
• Flip = strength toward $3.80 and beyond
🎯 Targets:
• $2.83 → Range reclaim level
• $3.50–3.60 → local resistance
• $5.36–5.37 → full upside liquidity target
🟥 Invalidation:
• Clean break below $1.90 (monthly support) = full invalidation
📌 Best setups form when liquidity is swept and price reclaims structure. Wait for the flush and follow strength.

SUi SUi Fui Fui - thats how shinchan saysOkay so shinchan says it gonna move up, loss and profits are yours lolol

Sui (SUI): Either We See Huge Drop or Huge Pump | 200EMA is KeySui is back near the 200EMA, where last time we had a strong rejection and movement to lower zones, which would have been an amazing entry for short.
So this time we will not miss the big move; we are looking either for a proper MSB to form to enter a short position here or a proper break of local high (BOS), which would give us a good opportunity for a long.
Swallow Academy

New month - new plan for SUIMarked key monthly levels as we begin a new cycle. Price currently trades below the monthly pivot point in correction mode, suggesting potential downside toward this week's support zone before looking for long entries. However, if price breaks down and fails to reclaim the weekly support S2, we may see continued downward momentum
More details in the video itself - enjoy watching!

Skeptic | SUI Breakdown: Precision Triggers for Spot & FuturesWelcome, traders, its Skeptic! 😎 Ready to unlock SUI’s next big move? I’m delivering a pro-level breakdown of SUI, the #12 crypto with a $10.4B market cap.This Analysis dives into recent performance, ecosystem growth, and technical triggers for spot and futures trading, all rooted in cycle-based strategies. Trade with no FOMO, no hype, just reason , Let’s conquer SUI! 🚖
Recent Performance & Key Events
SUI , trading at $ 2.98 with a $ 10.4 billion market cap, ranks as the # 12 cryptocurrency globally. A Layer-1 blockchain using the Move programming language, it boasts parallel transaction processing with over 160,000 TPS. In July 2025, SUI showed strong momentum, surging 10% in 24 hours and 12% weekly after bottoming in the $2.30–$2.40 range. However, a 44 million token unlock ($122M) on July 1 introduces potential selling pressure. 📊
Technical & Market Position
SUI’s Total Value Locked ( TVL ) reached $ 2.1 billion in early 2025, ranking it the 8th largest blockchain by TVL. Its DeFi ecosystem is exploding, with stablecoin volume jumping from $ 400M to $ 1.2B . Bitcoin integration and a Microsoft partnership bolster institutional adoption, signaling strong fundamentals despite volatility.
Technical Analysis
Daily Timeframe
The Daily (HWC) is in an uptrend, holding above the upward trendline (marked in blue). The major trend remains bullish unless this trendline breaks. However, the MWC is bearish, with declining volume during recent price rises suggesting a secondary corrective trend rather than a primary bullish trend. As Mark Andrew Lim notes in The Handbook of Technical Analysis, rising prices need increasing volume to confirm trader conviction and bullish momentum. Low volume indicates trend weakness, typical of corrective moves.
Spot Trigger (Long): Break of the downward corrective trendline with consolidation above resistance at $ 3.0408 . The last series breaking this trendline saw 85 % growth, but don’t rush in. Confirm with:
Falling BTC.D (Bitcoin dominance).
Total 3 long triggers (market-wide altcoin signals).
SUI/BTC uptrend, with an initial trigger on breaking its downward trendline and a primary trigger at 0.00003998 resistance.
Key Insight: Volume confirmation is critical. Without a volume surge on breakout, the risk of fakeouts is high.
4-Hour Timeframe (Futures Triggers)
On the 4-hour chart, if price reacts again at resistance $ 3.0890 , you can go long on a breakout, confirmed by RSI entering oversold. If it rejects sharply, the next long trigger is a break of $3.1606. For shorts, a break below support at $2.6593 is a strong trigger, especially with volume confirmation.
Pro Tip: Volume is king for all triggers. Without a volume spike on breakout, fakeout risk is high. Always apply capital management—1%–2% risk per trade to stay safe.
Final Vibe Check
This SUI Analysis equips you with precise triggers for spot ($3.0408) and futures ($3.0890/$3.1606 long, $2.6593 short) trading, leveraging cycle-based strategies. Want more cycle setups or another pair? Drop it in the comments! If this analysis sharpened your edge, hit that boost—it fuels my mission! 😊 Stay disciplined, fam! ✌️
💬 Let’s Talk!
Which SUI trigger are you eyeing? Share your thoughts in the comments, and let’s crush it together!

FRD Triggered the daily low. Started to accumulate position but only got gone lot in and it hit the target

SUI Is Ready To Run!Good Morning Trading Fam,
I'm putting out a quick trade setup here on SUI, a coin I am honestly a long-term hodl'er of. I believe this coin has an exciting future ahead of it with tremendous potential to change the blockchain landscape for the better.
But this post is for those of you interested in trading it.
We have a perfect setup here. Descending bullish triangle, which we are nearing the end of. Strong long-time support underneath us. And my proprietary indicator has given us a buy signal at the point of confluence of both of the above. I have set three targets for you. Obviously, the higher the target, the higher the risk. Trade accordingly and let me know in the comments how you did. It makes me happy to know my followers are successful in their trades.
Best,
Stew

SUI - Only way is up.BINANCE:SUIUSDT (1W CHART) Technical Analysis Update
SUI is currently trading at $2.77and showing overall bullish sentiment
Price has touches the trending support and managed to bounce back from the support, this is a good sign. I see a good opportunity for long trade here with a decent stoploss.
Entry level: $ 2.77
Stop Loss Level: $ 1.77
TakeProfit 1: $ 3.6997
TakeProfit 2: $ 4.2126
TakeProfit 3: $ 5.7785
TakeProfit 4: $ 9.5494
TakeProfit 5: $ 14.1762
Max Leverage: 5x
Position Size: 1% of capital
Remember to set your stop loss.
Follow our TradingView account for more technical analysis updates. | Like, share, and comment your thoughts.
Cheers
GreenCrypto

SUIUSD, almost near bottom, parabolic move nextSUI currently ay 2.65 is presently positioned near the lower boundary of its trendline. I expect an upward trajectory, potentially leading to a significant parabolic increase. We will monitor its progress.

SUI - SUI thats how air soundsSo i told how you air sounds, about SUI? It looks like it will take top liqudity and then form the force within what it shall happen!

SUI Collapse Incoming? Bearish Pattern You Can’t IgnoreYello, Paradisers! Is #SUI about to enter a bearish spell? We’ve seen this setup many times before, and the warning signs are stacking up fast. If you're not already positioned or protecting capital, now’s the time to pay attention.
💎SUIUSDT has started losing momentum just as a classic head and shoulders pattern has completed at the top, a formation often associated with trend reversals. This bearish structure is further validated by the presence of bearish divergence on momentum indicators, hinting at exhaustion from buyers and growing strength among sellers.
💎#SUIUSDT's neckline support at $3.60 has been breached, and since then, price has been sliding gradually. Right now, its on a path toward the $3.00 level, a moderate support area where some initial profit-taking may occur. However, according to the structure's full pattern target, the move is likely not over just yet.
💎Given the weakening market dynamics and lack of bullish follow-through, an extended dip cannot be ruled out. If sellers manage to overwhelm the $2.65 floor, the next potential landing zone would be around $2.30, a high-confluence level with a strong historical order block. This is a zone where a more meaningful bounce or even a longer-term reversal could initiate, but only if market sentiment finds footing.
💎On the other side, bulls face an uphill battle. They must reclaim the $3.65 to $3.80 resistance range, a zone that has consistently rejected upward attempts over the past several days. A breakout above this range would be the first sign of renewed bullish intent and could help ease the selling pressure.
Paradisers, strive for consistency, not quick profits. Treat the market as a businessman, not as a gambler.
MyCryptoParadise
iFeel the success🌴
