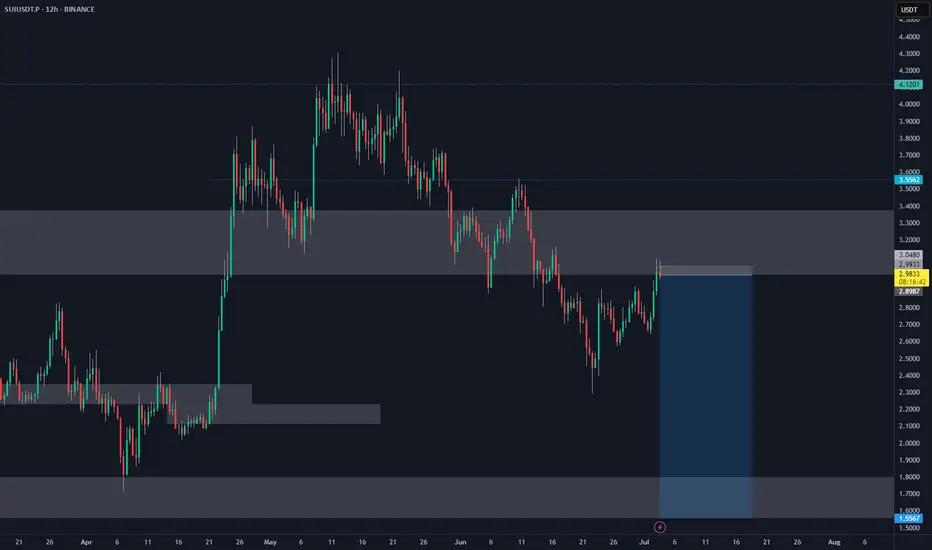
Short SUISUI has broken below both the 4-hour trendline and the daily horizontal support levels. The next key support zone lies around $2.20.
Setup is as in chart.
Disclaimer:
This analysis is based on my personnal views and is not a financial advice. Risk is under your control.
SUIUSDT.PS trade ideas

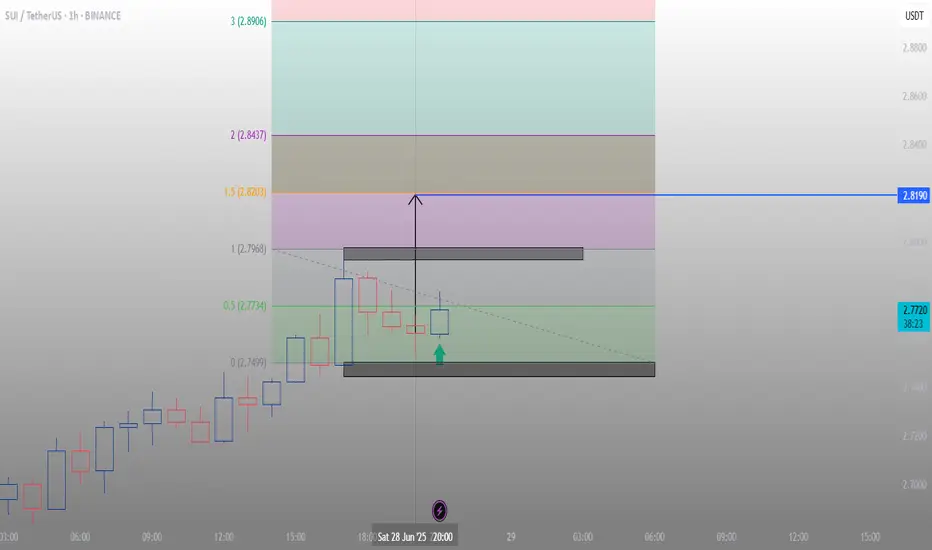
Sui - TradeI’ve opened a short-term long position on $SUI.
Entry: 0.618 Fib level at $2.7031
Stop-loss: $2.5765
Once I reach at least 2R in profit,
I’ll move the trade to break-even and begin taking profits.

Skeptic | SUI Breakdown: Precision Triggers for Spot & FuturesWelcome, traders, its Skeptic! 😎 Ready to unlock SUI’s next big move? I’m delivering a pro-level breakdown of SUI, the #12 crypto with a $10.4B market cap.This Analysis dives into recent performance, ecosystem growth, and technical triggers for spot and futures trading, all rooted in cycle-based strategies. Trade with no FOMO, no hype, just reason , Let’s conquer SUI! 🚖
Recent Performance & Key Events
SUI , trading at $ 2.98 with a $ 10.4 billion market cap, ranks as the # 12 cryptocurrency globally. A Layer-1 blockchain using the Move programming language, it boasts parallel transaction processing with over 160,000 TPS. In July 2025, SUI showed strong momentum, surging 10% in 24 hours and 12% weekly after bottoming in the $2.30–$2.40 range. However, a 44 million token unlock ($122M) on July 1 introduces potential selling pressure. 📊
Technical & Market Position
SUI’s Total Value Locked ( TVL ) reached $ 2.1 billion in early 2025, ranking it the 8th largest blockchain by TVL. Its DeFi ecosystem is exploding, with stablecoin volume jumping from $ 400M to $ 1.2B . Bitcoin integration and a Microsoft partnership bolster institutional adoption, signaling strong fundamentals despite volatility.
Technical Analysis
Daily Timeframe
The Daily (HWC) is in an uptrend, holding above the upward trendline (marked in blue). The major trend remains bullish unless this trendline breaks. However, the MWC is bearish, with declining volume during recent price rises suggesting a secondary corrective trend rather than a primary bullish trend. As Mark Andrew Lim notes in The Handbook of Technical Analysis, rising prices need increasing volume to confirm trader conviction and bullish momentum. Low volume indicates trend weakness, typical of corrective moves.
Spot Trigger (Long): Break of the downward corrective trendline with consolidation above resistance at $ 3.0408 . The last series breaking this trendline saw 85 % growth, but don’t rush in. Confirm with:
Falling BTC.D (Bitcoin dominance).
Total 3 long triggers (market-wide altcoin signals).
SUI/BTC uptrend, with an initial trigger on breaking its downward trendline and a primary trigger at 0.00003998 resistance.
Key Insight: Volume confirmation is critical. Without a volume surge on breakout, the risk of fakeouts is high.
4-Hour Timeframe (Futures Triggers)
On the 4-hour chart, if price reacts again at resistance $ 3.0890 , you can go long on a breakout, confirmed by RSI entering oversold. If it rejects sharply, the next long trigger is a break of $3.1606. For shorts, a break below support at $2.6593 is a strong trigger, especially with volume confirmation.
Pro Tip: Volume is king for all triggers. Without a volume spike on breakout, fakeout risk is high. Always apply capital management—1%–2% risk per trade to stay safe.
Final Vibe Check
This SUI Analysis equips you with precise triggers for spot ($3.0408) and futures ($3.0890/$3.1606 long, $2.6593 short) trading, leveraging cycle-based strategies. Want more cycle setups or another pair? Drop it in the comments! If this analysis sharpened your edge, hit that boost—it fuels my mission! 😊 Stay disciplined, fam! ✌️
💬 Let’s Talk!
Which SUI trigger are you eyeing? Share your thoughts in the comments, and let’s crush it together!

SUI - but not RonaldoI am getting ready to take a short position on SUI
Even though I like the chain, I supported it's growth - I think we will see new lows
But the worst chain? Aptos! Scammers
SUI/USDT Short Setup (2025-07-25)SUI/USDT Short setup for day traders.
Please enter with confirmation in 5M time frame.
⚠️ This Analysis will be updated ...
👤 Sadegh Ahmadi: GPTradersHub
📅 2025.Jul.2
⚠️(DYOR)
❤️ If you apperciate my work , Please like and comment , It Keeps me motivated to do better

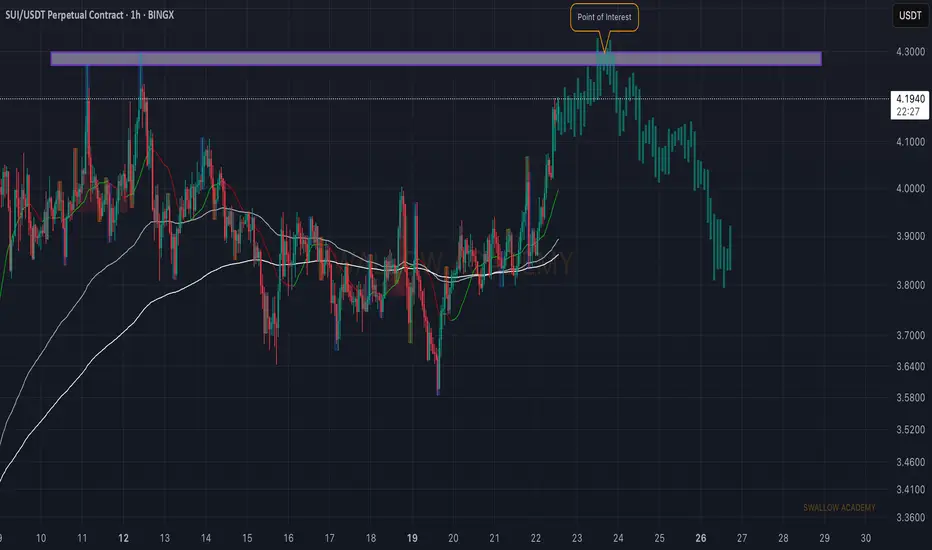
Sui (SUI): Looking For Further Upward Movement Sui coin is showing strong buyside movement where price is heading towards the local high area of the liquidity zone. We are aiming to see the touch to that area, from where we will be looking for some signs of weakness and entry for a short position.
Swallow Academy

inside daygap time broke the low of the rising session lows, london pulled back with 3 pushes. it broke the low of the 15 mins 3 push pattern, pulled back and now continuing. looking for a quick drop

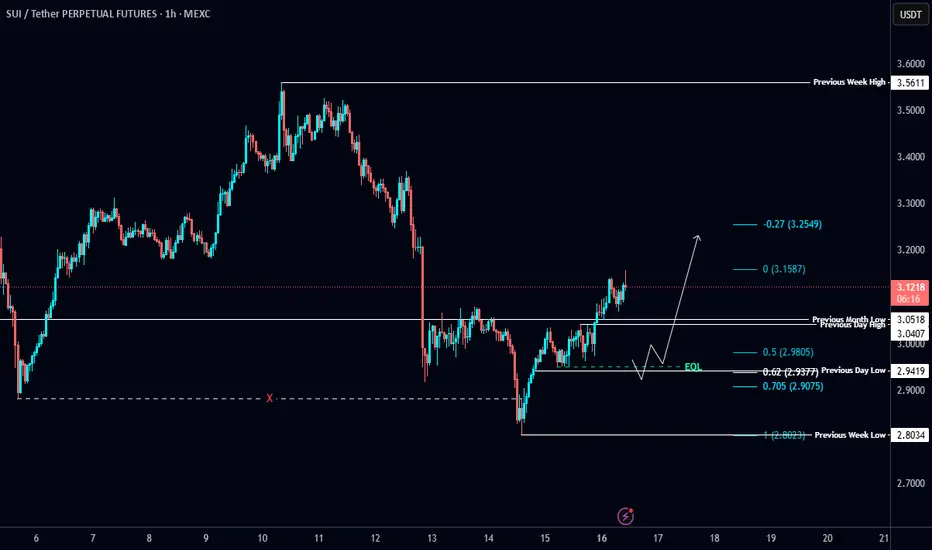
sui usdt tradeBased on the time analysis and the blocks created, I believe the target shown in the image is the next price target.
Pre-emptive W patternW pattern forming double bottom here then send to $12 that simple
potentially down to $2.30 - $2.50 max pain then if not here onwards and at 4 we tab off for the W and then boom rocket town.
Buckel up this is what I think, SUI loves W's
DYOR
I spoke to the one of the CO founders in an interview and everything is pointing towards this....


SUI Long Swing Setup – Confluence of Support and Fibonacci LevelSUI has pulled back into a key confluence zone, aligning with both the 61.8% Fibonacci retracement and horizontal support. We’re now eyeing the $2.70–$2.80 area for a potential long entry.
📌 Trade Setup:
• Entry Zone: $2.70 – $2.80
• Take Profit Targets:
o 🥇 $3.40 – $3.60
o 🥈 $4.00 – $4.20
• Stop Loss: Daily close below $2.65

SUI - overhyped or does it have a FUTURE?⚡️ Hello everyone! So far, there has been nothing unexpected in Bitcoin for me personally to update the review. Let's take a look at one of the main altcoins of the season - SUI.
The project burst onto the scene very quickly, with some people writing it off when it hit $1. But it successfully reached $5+, which begs the question: what was that all about? A fleeting narrative or a new token of the future?
📊 Now the token has formed a flag, like many other projects on the market, and is effectively “nowhere.” Gradually approaching both sides of the slope, let's dig deeper to understand which direction a breakout is most likely.
I am not a fundamental expert, but I know that the number of network users is actively growing along with TVL. New projects are being launched and partnerships are being formed (Trump's WLFI).
❓ But what does the chart tell us?
Money Flow - harmony with price. Positions are gradually closing, liquidity is leaving. But there is a divergence in the inflow, the indicator is already forming new lows, while the price is significantly higher than the previous low. This means that people are not yet ready to buy at the current price.
Liquidity Depth - there is currently significantly more liquidity concentrated at the top than at the bottom. This is understandable, as the token has been declining for a long time and is trading below its ATH, with a lot of shorts accumulated. And as we know, the price moves from one liquidity zone to another—that is its fuel. However, despite this, the nearest large liquidity cluster is at the bottom, at levels of 2.13 - 2.04.
Volume - one of the only tokens on the market where sales volumes remain harmonious even after 6 months of correction. The token grew for a very long time, many held on to it and are now continuing to take profits.
📌 Conclusion:
I believe the token clearly has potential. But it is too young, and it is difficult to determine its real value at this point. Many tokens that were a hit in 2021 are now, well, you know where...
So, I am currently considering SUI purely as a speculative asset, and the bear market will show who is who.
I believe that now, together with the entire market, we are going lower, removing liquidity from the 2.13-2.04 level. A correction below 1.7246 (previous low) is even likely.
📈 And from this zone, I begin to consider the possibility of a rebound and taking a long position.
Have a nice day, everyone!

Sui cup and handleThanks to @leu76 i think we are going to make a cup and handle.
We just need to stay above the 0.5 fib.
Target to the 2 fib

Sui Update, Retest of Support; Bullish ConfirmedIt's been 9 days since my last Sui update. The chart looks good.
For context, see the previous analysis:
We started at the C wave of an ABC correction. There was an attempt to push prices higher but resistance was found at MA200. The resistance produced retrace and the same support zone is tested and holds. If a new advance develops here, which is exactly what is going to happen, then you can expect much higher prices next. This time around, MA200 as resistance will break, which means a new high. The highest prices in more than six months, since January 2025.
This is where the next move will take us and this is easy to predict now that support has gone through a retest and holds.

Sui Turning Green ($6.65 Target = 100%+ PP)Just like that Sui was red for 24 days. 24 days might not be that long but when you consider that the rise lasted 35 days, then yes, within this context it is a very long retrace... And look at the levels on the chart.
Support found at 0.5 Fib. retracement. This level was pierced followed by a recovery the next day. Double-bullish signal; the recovery and the fact that 0.618 wasn't tested.
I can honestly say that it is still early, but I can also say that this zone where the bounce just happened is a very strong classic support zone. This support zone can lead to the next leg-up, a strong rise with targets reaching $5.19 and $6.65.
The chart looks good for a new bullish wave. The $6.65 target means more than 100%. Taken from the 7-April low, we are talking about a 285% total growth, profits of course. And this wouldn't be the end, only the start.
SUIUSDT has much more to give. We can expect the market to turn and remained green.

#SUI/USDT#SUI
The price is moving within a descending channel on the 1-hour frame, adhering well to it, and is heading toward a strong breakout and retest.
We are experiencing a rebound from the lower boundary of the descending channel, which is support at 2.90.
We are experiencing a downtrend on the RSI indicator that is about to break and retest, supporting the upward trend.
We are heading toward stability above the 100 Moving Average.
Entry price: 3.00
First target: 3.07
Second target: 3.15
Third target: 3.24

SUI MAJOR BUY ZONESUIUSDT rejected from marked supply zone and looks to dump more as well. So Major buy zone is around 2.15-2.30. Keep eyes on that level.

#SUI/USDT Analysis📊 #SUI/USDT Analysis 📊
CRYPTOCAP:SUI snatched liquidity and bounced with a clean V-shaped recovery 🐢💥
🔺 For longs: I want to see Equal Lows or PDL swept, followed by a tap into the OTE level for confirmation.
Let price come to you — sniper mode only🎯
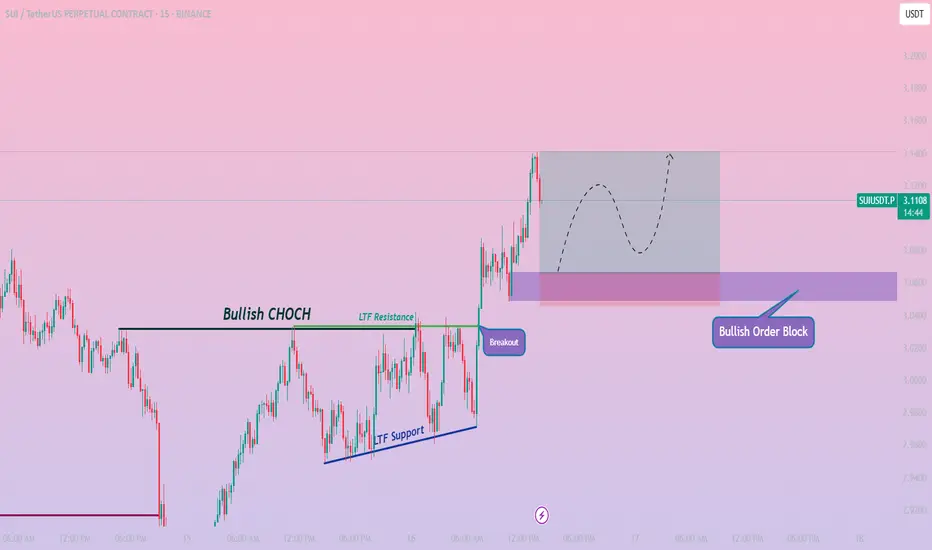
SUIUSDT / 15M / LONG🔍 Analysis:
I used Smart Money Concepts (SMC) and Price Action to build this setup.
The market recently formed a Bullish Order Block between 3.0669 and 3.0484, which aligns with the discount zone of the current price swing.
This suggests smart money accumulation in the demand zone, and a possible bullish internal shift of structure.
SUIUSDT / 15M / LONG
🔹Entry: 3.0662
🎯Take Profit (TP): 3.1407
🛑Stop Loss (SL): 3.0456
📊Risk-Reward Ratio (RRR): ~1:3.62
📅 Timeframe: 15 Minutes
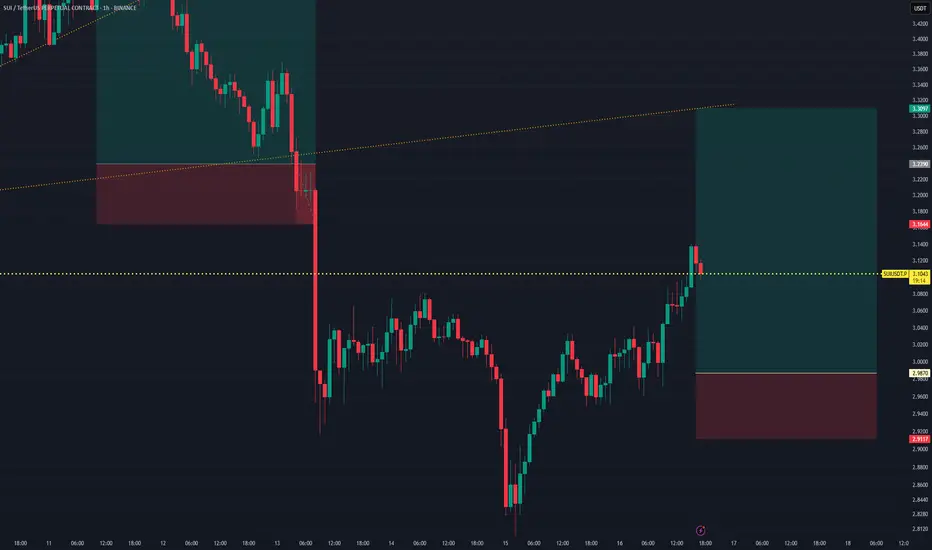
SUIUSDT.P Long Setup — Entry at 2.9870 | Targeting 3.3097This long trade setup on SUIUSDT.P is based on a bullish breakout structure with a clean upward momentum. Entry is placed at 2.9870, aligned with recent support confirmation. The Take Profit is set at 3.3097, targeting the next resistance zone, while the Stop Loss is secured at 2.9117 to manage downside risk. The trade offers a strong Risk-to-Reward Ratio of 4.28, making it a high-conviction opportunity in a trending market environment.
Sui Update, Retest of Support; Bullish ConfirmedIt's been 9 days since my last Sui update. The chart looks good.
For context, see the previous analysis:
We started at the C wave of an ABC correction. There was an attempt to push prices higher but resistance was found at MA200. The resistance produced retrace and the same support zone is tested and holds. If a new advance develops here, which is exactly what is going to happen, then you can expect much higher prices next. This time around, MA200 as resistance will break, which means a new high. The highest prices in more than six months, since January 2025.
This is where the next move will take us and this is easy to predict now that support has gone through a retest and holds.
Namaste.

