Sui (SUI): Might Be Selling Opportunity (If all goes by plan)Sui coin had a good MSB with recent news about trade deals by Trump. Now that we filled the FVGs, we are going to look for weakness to kick in, which would give us the final confirmation in the form of BOS and then we can see further movement to lower zones from here.
Swallow Academy
Related pairs

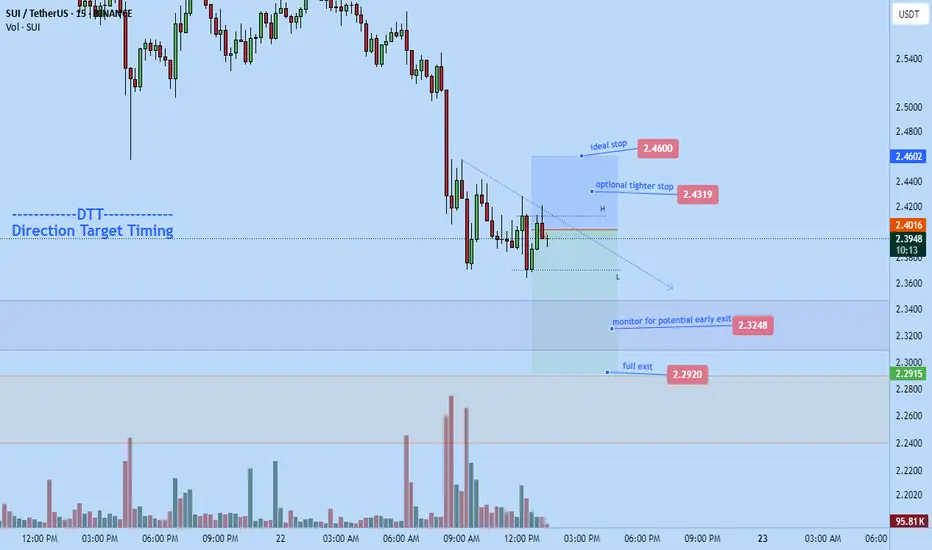
Sui short to $2.2920Went short on sui a while ago. I think the market is likely to push down a bit more before we have any major corrective move based on my DTT analysis
Stop: $2.46 for better invalidation
Tp $2.2920
potential early close at $2.3248
Time sensitive
Sui: Bullish Potential w Leverage, Between 4-8X (PP: 720%-1440%)Sui looks great right now. This is a pair that I am approaching with leverage considering only a relatively small range, a 180% target. When multiplied by your number of leverage you can get an idea of the total profits potential. For example, 8X would be equal to 1440% while 4X gives 720%.
Techni

$SUI follow up for June 2025CRYPTOCAP:SUI has tapped my support zone around $2.85, which is currently holding well.
That said, the broader trend remains corrective, and it's likely only a matter of time before this support gives way.
If that happens, we could see a drop into my green buy zone — sitting just below a major ord

ouchDidn’t Work out as I expected, so took a loss, it’s ok, live to fight another day. These post are my journal and tracking progress

$SUI is still moving inside a falling channel!!CRYPTOCAP:SUI is still moving inside a falling channel on the 12H chart.
The price is near the bottom of the channel and starting to slow down.
If it breaks out from here, it could move up toward $4, that’s around 50% higher.
No breakout yet, but the setup looks interesting.
DYOR, NFA

SUI - Only way is up.BINANCE:SUIUSDT (1W CHART) Technical Analysis Update
SUI is currently trading at $2.77and showing overall bullish sentiment
Price has touches the trending support and managed to bounce back from the support, this is a good sign. I see a good opportunity for long trade here with a decent stoploss.

SUI Collapse Incoming? Bearish Pattern You Can’t IgnoreYello, Paradisers! Is #SUI about to enter a bearish spell? We’ve seen this setup many times before, and the warning signs are stacking up fast. If you're not already positioned or protecting capital, now’s the time to pay attention.
💎SUIUSDT has started losing momentum just as a classic head and sh

SUI Is Ready To Run!Good Morning Trading Fam,
I'm putting out a quick trade setup here on SUI, a coin I am honestly a long-term hodl'er of. I believe this coin has an exciting future ahead of it with tremendous potential to change the blockchain landscape for the better.
But this post is for those of you interested i

SUI | — Key Buy Trigger AheadPrice is drifting lower and approaching a high-confluence retracement zone. A key bullish setup may form if price sweeps the 0.618–0.666 Fibonacci region and reclaims the level with strength.
📌 Buy Trigger:
• Sweep into the $2.38–2.5 zone
• Look for reclaim and bullish reversal for long entry
• Str

See all ideas
Summarizing what the indicators are suggesting.
Oscillators
Neutral
SellBuy
Strong sellStrong buy
Strong sellSellNeutralBuyStrong buy
Oscillators
Neutral
SellBuy
Strong sellStrong buy
Strong sellSellNeutralBuyStrong buy
Summary
Neutral
SellBuy
Strong sellStrong buy
Strong sellSellNeutralBuyStrong buy
Summary
Neutral
SellBuy
Strong sellStrong buy
Strong sellSellNeutralBuyStrong buy
Summary
Neutral
SellBuy
Strong sellStrong buy
Strong sellSellNeutralBuyStrong buy
Moving Averages
Neutral
SellBuy
Strong sellStrong buy
Strong sellSellNeutralBuyStrong buy
Moving Averages
Neutral
SellBuy
Strong sellStrong buy
Strong sellSellNeutralBuyStrong buy
Displays a symbol's price movements over previous years to identify recurring trends.
Frequently Asked Questions
The current price of Sui / Tether US (SUI) is 2.7983 USDT — it has fallen −2.81% in the past 24 hours. Try placing this info into the context by checking out what coins are also gaining and losing at the moment and seeing SUI price chart.
Sui / Tether US price has risen by 15.07% over the last week, its month performance shows a −11.57% decrease, and as for the last year, Sui / Tether US has increased by 257.43%. See more dynamics on SUI price chart.
Keep track of coins' changes with our Crypto Coins Heatmap.
Keep track of coins' changes with our Crypto Coins Heatmap.
Sui / Tether US (SUI) reached its highest price on Jan 6, 2025 — it amounted to 5.3687 USDT. Find more insights on the SUI price chart.
See the list of crypto gainers and choose what best fits your strategy.
See the list of crypto gainers and choose what best fits your strategy.
Sui / Tether US (SUI) reached the lowest price of 0.3628 USDT on Oct 19, 2023. View more Sui / Tether US dynamics on the price chart.
See the list of crypto losers to find unexpected opportunities.
See the list of crypto losers to find unexpected opportunities.
The safest choice when buying SUI is to go to a well-known crypto exchange. Some of the popular names are Binance, Coinbase, Kraken. But you'll have to find a reliable broker and create an account first. You can trade SUI right from TradingView charts — just choose a broker and connect to your account.
Crypto markets are famous for their volatility, so one should study all the available stats before adding crypto assets to their portfolio. Very often it's technical analysis that comes in handy. We prepared technical ratings for Sui / Tether US (SUI): today its technical analysis shows the sell signal, and according to the 1 week rating SUI shows the sell signal. And you'd better dig deeper and study 1 month rating too — it's neutral. Find inspiration in Sui / Tether US trading ideas and keep track of what's moving crypto markets with our crypto news feed.
Sui / Tether US (SUI) is just as reliable as any other crypto asset — this corner of the world market is highly volatile. Today, for instance, Sui / Tether US is estimated as 6.40% volatile. The only thing it means is that you must prepare and examine all available information before making a decision. And if you're not sure about Sui / Tether US, you can find more inspiration in our curated watchlists.
You can discuss Sui / Tether US (SUI) with other users in our public chats, Minds or in the comments to Ideas.