SUI/USDT Is a Trend Reversal on the Horizon?1D CHART of SUI on USDT market pair. indicates a potential trend reversal following a prolonged downtrend within a descending parallel channel. The price has consistently formed lower highs and lower lows, indicating strong bearish momentum. However, a recent breakout from the channel suggests a possible shift towards bullish price action.
A critical support zone around $2.00 has shown significance, as buyers have stepped in to defend this level, preventing further declines.
This breakout signals a potential trend change, with the price now targeting key resistance levels at $2.9357, $3.5131, and $4.2060. In an extended bullish scenario, the price could reach as high as $4.7538.
SUIUSDT trade ideas

#SUI/USDT#SUI
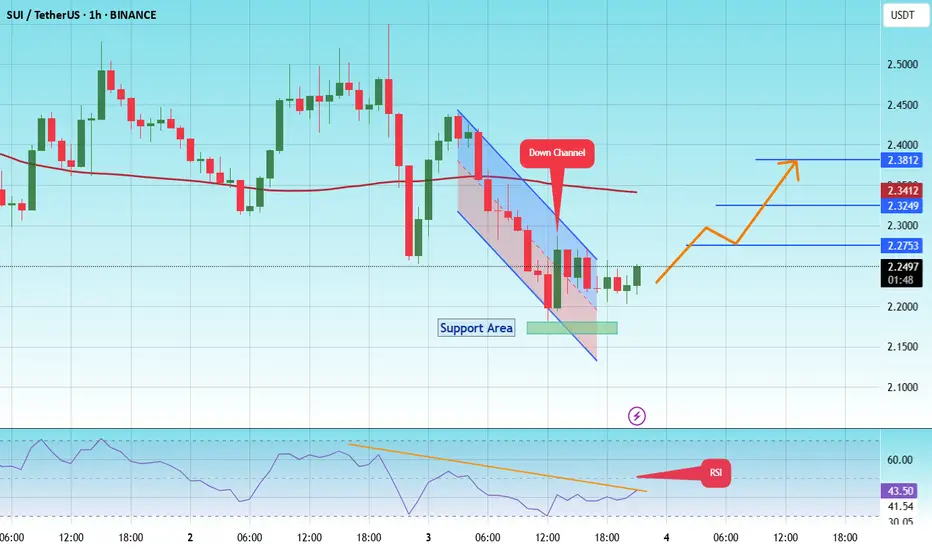
The price is moving in a descending channel on the 1-hour frame and is expected to continue upward.
We have a trend to stabilize above the 100 moving average once again.
We have a downtrend on the RSI indicator, supporting the upward move with a breakout.
We have a support area at the lower boundary of the channel at 2.17.
Entry price: 2.24
First target: 2.27
Second target: 2.32
Third target: 2.38
Sui Bear Flag !! Big Cluster liquidity area
Bearish Continuation Trade Idea - Potential Breakdown from Bear Flag
📉 Market Outlook:
The price has been in a strong downtrend, forming a bear flag after an impulsive move downward. This pattern is typically a continuation signal, suggesting further downside if the price breaks below the flag structure.
📍 Key Observations:
1️⃣ Big Cluster Liquidity Area: The highlighted zone marks an area where the price previously accumulated/distributed liquidity before a strong breakout. Now that the price has fallen below this region, it is acting as a major resistance.
2️⃣ Bear Flag Formation: After a steep decline, the price is moving inside a narrow ascending channel, which often acts as a bearish continuation pattern.
3️⃣ Potential Breakdown: A clear break below the lower boundary of the flag could confirm the next leg down.
🔴 Trade Plan (Short Setup):
Entry Trigger: Wait for a confirmed breakdown below the bear flag's lower boundary, ideally with a strong bearish candle close.
Stop Loss: Place above the recent swing high inside the flag to limit risk.
Take Profit Targets:
First target: Recent swing low
Second target: Major support zone with historical liquidity
⚠️ Risk Management:
Position sizing should align with your risk tolerance.
Beware of false breakouts; a confirmed breakdown with strong momentum is preferred.
Monitor macroeconomic events that might cause volatility.
📌 Conclusion:
The overall trend remains bearish, and the formation of a bear flag suggests further downside if confirmed. If the price breaks lower with conviction, sellers may push it toward key support levels.
🔔 Disclaimer: This is NOT financial advice. Always conduct your own analysis and manage risk accordingly.
Would love to hear your thoughts—drop a comment below! 🚀🔥

SUIUSD I Weekly CLS, Key level - OB I Model 2, Multiple targetsHey Traders!!
Feel free to share your thoughts, charts, and questions in the comments below—I'm about fostering constructive, positive discussions!
🧩 What is CLS?
CLS represents the "smart money" across all markets. It brings together the capital from the largest investment and central banks, boasting a daily volume of over 6.5 trillion.
✅By understanding how CLS operates—its specific modes and timings—you gain a powerful edge with more precise entries and well-defined targets.
🛡️Follow me and take a closer look at Models 1 and 2.
These models are key to unlocking the market's potential and can guide you toward smarter trading decisions.
📍Remember, no strategy offers a 100%-win rate—trading is a journey of constant learning and improvement. While our approaches often yield strong profits, occasional setbacks are part of the process. Embrace every experience as an opportunity to refine your skills and grow.
Wishing you continued success on your trading journey. May this educational post inspire you to become an even better trader!
“Adapt what is useful, reject what is useless, and add what is specifically your own.”
David Perk ⚔

SUI ready to provide structure? Be prepared for downside.SUI is at a good level, to get some support. There are further levels to get support below. However, a pivot structure can be built here. Momentum has room to get further oversold, but some downsides could still happen. DCA is the best strategy.
Full TA: Link in the BIO

SUI x10 in 3 months SUI is one of the few cryptocurrencies that has managed to maintain a bullish pattern in this abominable cycle. Time is 2nd quarter of 2025
Target $20+
Stop 20%
Invest 5% depo
Risk / Profit 1:50 🔥

#SUIusdtThe period of growth and show-off of this coin is over. Coins that are not American and try to attach themselves to America are not worth investing in.
And any coin that starts negotiating with Trump to enter the American market will soon disappear.
And experience has proven that any coin that gets close to Trump is doomed to pay him a ransom for growth and will disappear when he finishes paying the ransom.

SUIUSDT Trade IdeaHello guys!
This is my idea about SUI/USDT.
Of course, this is not financial advice, but I’d like to share my opinion on this coin ‘cause I want to see how future me reacts to it. XD
If you use this idea, let me know in the comments—it makes me happy <3

sui usdt ready to lead ALTS?Looking to long SUI as close to 2.4 as possible
Reclaimed key support level after forming A&E pattern
Above 50 level on both 4h and 12h rsi
Was the fastest horse of the market when the market started its trend in 2024. Should lead again
Broke out of the trendline after the fakeout. Usually fakeout --> retest support --> real breakout occurs

SUI/USDT:BUY LIMITHello friends
Due to the heavy price drop, it can be seen that the buyers have supported the price well at the specified support and by hitting higher ceilings and floors, they are giving us a sign that they have good strength. Now we can buy in steps with capital and risk management and move to the specified targets.
Don't forget to save profit on each target.
*Trade safely with us*

SuiUsdt Trade setup 12-15% upside ??recent impluse momentum with a formation of HL on 1h could be a sign of trend change
trade entry at2.300 to 2.350 demand zone further up at 2.5 can be the potential pullback area and could then face resistance at 2.65
and considering the down side risk at 2.200 can be the stop loss as it is recent low that bulls will try to defend

#SUI/USDT#SUI
The price is moving within a descending channel on the 1-hour frame and is expected to continue lower.
We have a trend to stabilize below the 100 moving average once again.
We have a downtrend on the RSI indicator, supporting the upward move with a break above it.
We have a resistance area at the upper limit of the channel at 2.55.
Entry price: 2.52
First target: 2.40
Second target: 2.32
Third target: 2.20

SUI/USDT long/buyBy utilizing Fibonacci retracement levels, historical patterns, , we can formulate a hypothesis that the market might follow a similar trajectory if bullish sentiment prevails.

SUI ON BULLISH -> $10+ Important Note: Trading involves risk, and this analysis is based on the provided chart and description. Traders should conduct their own thorough research and analysis before making any trading decisions. Remember to confirm the timeframe and adjust the stop loss based on your own risk management strategy.

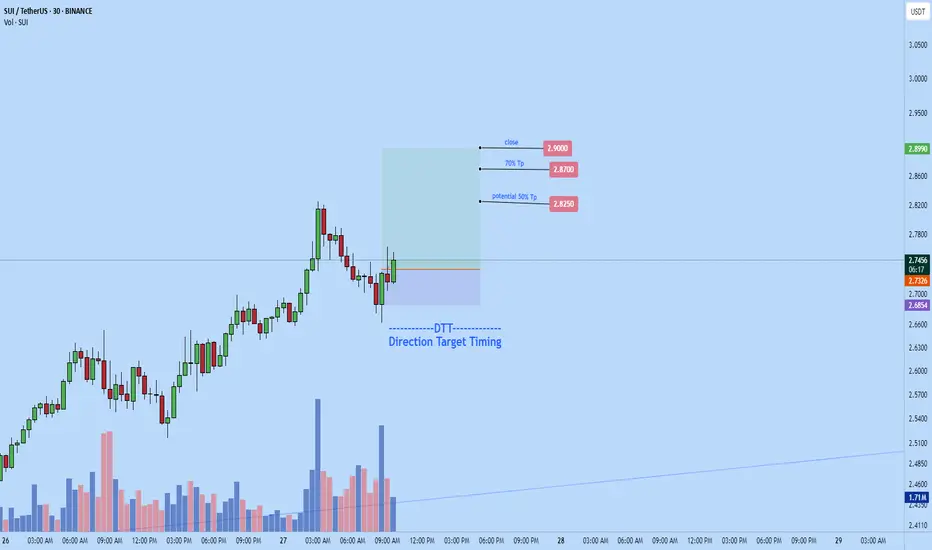
Sui long to $2.9 TodayTook a long position on sui last night and Just now re-entered for another long trade.
See targets on chart
Buyers Regain Momentum After Big SelloffThe MEXC:SUIUSDT.P futures market is really heating up, as big exchange buyers at Binance, OKX, Coinbase and others regain momentum. Sui continues to be under-priced at the moment, but market sentiment has been very mixed, with TA showing both rising up-channel, as well as "death cross" crash potential. The current trend reversal may signal that momentum is on the taker side as investors gain interest seeing numbers, who may not have been active in Sui market have decided to get a piece of the action.
At this time 03:40 UTC I see futures market volume on the level of 500-600% or greater, above CEX spot market volumes. For example, Coinbase volume jumped from 4 to 6.77M in the last 60 minutes, while MEXC perpetuals have exploded from 36m to 59-60M in the last 45 minutes. All this is a good indicator especially considering we are outside normal workday hours. Perhaps traders around the world are taking notice of Sui as market volume increases.
Watch those volume levels closely for signs of reversal at major exchanges - Binance BINANCE:SUIUSD Coinbase COINBASE:SUIUSD OKX OKX:SUIUSD and other high volume markets - BB Squeeze indicator is quite effective here for the perceptive trader.
Stay tuned habibi

Sui Technical AnalyzeTrend: The price is forming an ascending channel (orange lines), which is generally a bullish sign.
Support: The green zone around 2.30 is a strong support level to keep an eye on.
Resistance: The resistance at 5.60–7.00 is a critical point. A breakout above this level could signal significant upside potential.
Volume: Volume is low and needs to pick up for a clear trend direction to emerge.
Price Action: Look for a retest of the green support. If it holds, the price may push upwards towards 5.60–7.00. Otherwise, a breakdown below 2.30 could indicate a reversal.

Lingrid | SUIUSDT fake break of CONSOLIDATtion zoneThe price perfectly fulfills my last idea . It hit the target level. BINANCE:SUIUSDT consolidated around the 2.30 level before breaking above it; however, the price subsequently pulled back and returned to the consolidation zone. This behavior resembles a "dead cat bounce," as we did not observe further upward movement. Below, we can see an upward trendline that has been tested multiple times. I believe the price may break through this trendline and continue moving downward since it was tested may times. My goal is support zone around 2.100
Traders, If you liked this educational post🎓, give it a boost 🚀 and drop a comment 📣

SUI - Solid Levels (given days ago)Look how precise were those levels !
Like Sniping ...
I had forgotten SUI completely.
Original TA :
Follow for more ideas/Signals. 💲
Look at my other ideas 😉
Just donate some of your profit to Animal rights and rescue or other charity :)✌️

SUI Swing: The Art of Patience in TradingSUI has been playing nice with the technicals lately, giving us some really neat swing trade opportunities. Remember that short trade we talked about—from $3 down to around $2? Well, here's why that setup was a winner.
After that initial short trade, SUI bounced off $2 and then traded in a tight range between $2.5 and $2.2 for about two weeks. Then it broke higher to test the monthly open at $2.83—and it hit that level right on the dot. That’s where all the magic happens.
Why This Short Trade Worked
Fibonacci Confluence: When you draw a Fibonacci from the high at $3 to the low at $1.9626, the 0.786 level comes in at about $2.778. This is right near the monthly open, and we know that price tends to reverse between the 0.618 and 0.786 zones.
Trading Range POC: The $2.8 area was our previous point of control, so it adds extra weight as a resistance level.
Anchored VWAP: The VWAP from the high at $3.8999 sits just above the monthly open at around $2.855, giving us another nod that this level is important.
Fib Speed Resistance Fan: Even the speed resistance fan at the 0.618 level lines up with the $2.8 zone.
All these factors lined up to form a solid resistance area. That’s why short entries between $2.778 and $2.855 made sense.
Trade Setup Recap
Short Trade:
Entry Zone: $2.778 to $2.855
Target: The bullish order block at about $2.4745, which also lines up with the 0.618 fib retracement from the low at $2.2358 and the high at $2.8309
Risk-to-Reward: This setup gave us a risk-to-reward of 4:1 or even better, depending on where you set your stop-loss.
There’s also a possible long trade at the bullish order block, but that one’s only for when you see the confirmation.
Wrapping It Up
The takeaway? Confluence is your best friend. Waiting for that high-probability setup can really pay off. Let the trade come to you, don’t force it, and stay calm and focused.
Thanks for reading this SUI analysis. If you liked it, please leave a like and drop a comment. Happy trading!

$SUI Breakout Alert – Can Bulls Sustain Momentum?
CRYPTOCAP:SUI has successfully broken the descending trendline resistance, signaling a potential shift in momentum. The next move depends on whether the breakout holds.
🚀 Price has cleared key resistance, opening the door for further upside
🔄 A retest of the breakout zone could provide confirmation
📈 If momentum sustains, SUI may push toward higher levels
Watch for a successful retest or an immediate continuation to confirm strength 👀

SUIMonthly and Weekly are both in an uptrend.
Trend is retesting on a daily time frame. Golden zone is where I would look for longs.
Trend is drawn to Weekly inducement though I do not think it would even sweep it as that would signal a further correction.

SUI - Falling Wedge - Confirmed BreakoutBINANCE:SUIUSDT (1D CHART) Technical Analysis Update
SUI is currently trading at $2.77 and showing overall bullish sentiment
Price has formed nice falling wedge and we see a clear breakout from the falling wedge pattern. I'm expecting this trend to hold and read the resistance level around $5.3
Entry level: $2.7
Stop Loss Level: $1.8
TakeProfit 1: $3.1
TakeProfit 2: $4
TakeProfit 3: $5.3
Max Leverage: 2x
Position Size: 1% of capital
Remember to set your stop loss.
Follow our TradingView account for more technical analysis updates. | Like, share, and comment your thoughts.
Cheers
GreenCrypto
