SUI update#SUI has a clear pattern for bullish but i think that its better not to rush for long position and wait for BTC bearish spike and then make a long position also this spike down which sui made yesterday tool all the liq in lower prices around 3 $ check this out
SUIUSDT trade ideas

This is SUIFollow the instructions, if the price respects the trend line, then definitely it will rise!
If the price breaks the trendline, you can sell.

SUI head and shoulder breakout tradeSUI head and shoulder breakout trade to get back to the daily pivot. Waiting for a break of the neck line and retest.

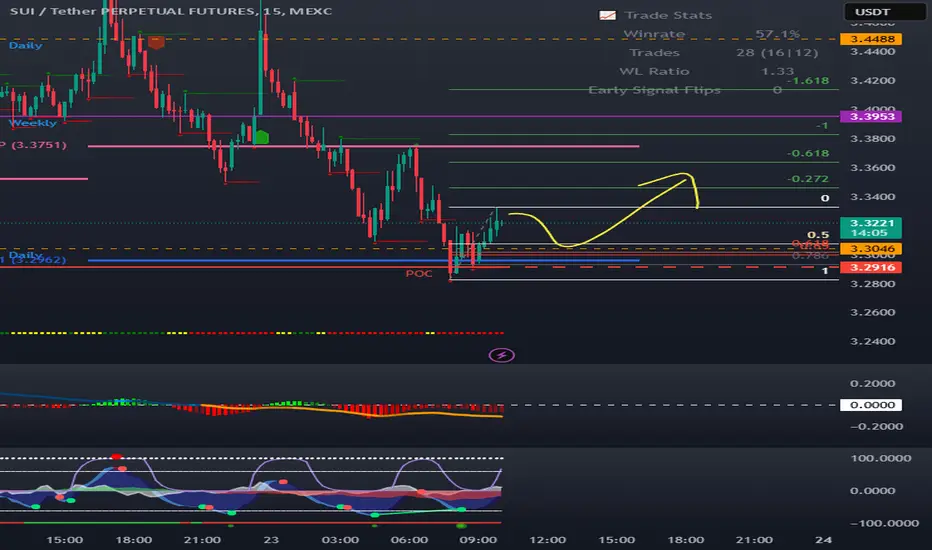
SUI 15m Long SignalSUI 15m Long Signal
Reason:
- Bounce at S2 support level
- Bounce at 1.27 take profit for shorts
- Liquidity grab and go setup

SUI update#SUI update
the market made a triangle as a correction structure i think that the price will rise alot after crossing the confirmation line so its better to wait for a good confirm

SUI update (34% profit 1X)#SUI has a nice pattern at the end of the chart we can see a clear triangle if the price crosses the confirmation line we have 2 levels as targets based on volume traded on these levels

SUIUSDT LONGhi guys just a little idea on SUI, it has been going sideways if we break both above the resistance level and the trend line which held the price down strongly, that for me is a good sign of a trend shift to the upside. if all I said is true, I will buy the SUI. Share your idea down the comment
but always remember
TO HAVE A STOPLOSS PROTECTION
TO RISK ONLY WHAT YOU CAN AFFORD TO LOSS
USE THE GOLDEN RULE OF THE 1% RISK OR IF YOU ARE AGGRESIVE 2% OF YOUR ACCOUNT PER TRADE

34% PROFIT 1X ON SUI !#SUI made a triangle with 5 waves this can be a sing of a bullish structure IF THE CONFIRMATION LINE BE BROKEN !
becareful if the market doesnt break the line this pattern will be rejected !
check out my analysis on higher time frames on this coin !

SUI trade setup for the day 15mSUI trade setup for the day 15m. Bullish momentum continues so waiting for a pullback to support lines/golden pocket for an entry.

SUIUSDT 8HSUI ~ 8H Analysis
#SUI On the time frame 8H, Selling pressure on this coin seems to have been completed. Buy after successfully penetrating this resistant line with a minimum target of 10%+.

A GREAT OPPORTUNITY JUST CAME UP! LONGS OR SHORTSHi everyone!
While everyone believes that SUI/USDT is the real deal, Our experienced team has another opinion!
While SUI shows accumulative signals and bullish pattern to confuse all of us the retail traders..
We working very hard guys for you in order to reach the financial freedom!
SUI/USDT is about to crash!!!
And we talk at least for a 30% drop.. Yes you read very well!
Now here is the thing.. You have to manage your risk!
You have to be prepared for a 20% pump, that's why you are not opening big positions straight away. Spread your capital for every 5%.. And when the price will reach 2.41 disappear.. Take your profits and enjoy them, as we will do!
Stay tuned for more..

SUISUI the beast i missed out when 0.78.
So regarding the time that it took to change direction after the correction ( but not as i thought it will do the correction- marked on the chart) i thinkthe direction of sui if the market conditions will be good, then we could see the price over 5.5 or even 6.2$
i wish next week to be hot, lets be patient and wait.
this price should hit during the next week
nfa
dyor
if so i will go spot

SUISUI: Potential double bottom forming here. Confirmation with daily close above $3.70.
Another way to see this, long until 3.70, then wait for others to crash the resistance.


SUI long trade signal 15mSUI long trade signal 15m. Just a simple scalp for the day that could turn into a swing. Not financial advice.

Sui will unlock token !!"On February 1st, SUI will unlock 338.65M tokens, increasing the supply. So be cautious. If you want to buy more SUI, you should wait for the Fibonacci zone I mentioned in the chart.

Sui long to $3.39i just opened a long on sui. I anticipate that it will get a breakout pump tonight up to $3.39 area Before potentially pushing back down...or who knows maybe it breaks higher but that's my conservative target.

SUI/USDT 1H: Distribution in Play – Short Setup recent lows?SUI/USDT 1H: Distribution in Play – Short Setup Targeting Recent Lows?
🚀 Follow me on TradingView if you respect our charts! 📈 Daily updates!
Current Market Structure:
Bearish trend continues, with a recent bounce off $2.90 support.
Price now at $3.17, showing signs of consolidation.
Market Maker Activity:
Clear distribution pattern visible in the $3.25-3.35 zone, suggesting institutional unloading.
Technical Indicators:
Hidden bearish divergence on RSI.
Multiple lower highs forming on the 1H timeframe.
Strong resistance cluster at $3.25-3.35 supports the bearish outlook.
Trade Setup (Confidence 8/10):
Short Entry: Look to enter at $3.22-3.25 (resistance zone).
Targets:
T1: $3.05
T2: $2.90
Stop Loss: Place at $3.35 (above recent resistance).
Risk Score:
7/10 – Favorable risk-to-reward, provided price is rejected at the resistance zone.
Recommendation:
Wait for confirmation of rejection at $3.22-3.25 before entering a short position.
The strong distribution pattern and technical signals suggest continued downside toward recent lows.
🚀 Follow me on TradingView if you respect our charts! 📈 Daily updates!

Sui Important level ! We have retraced to BISI near Equilibrium and close to OTE level
This zone is a market maker accumulation zone
Remember this when we are in bullish trend they will hunt Longs !
we can still see lower prices - we can hit previous weekly candle low
Don't be scared of these type of moves
5.6$ soon !

SUI GAME PLAN - SUI NETWORKI will be watching the $2.22 price level for building spot and swing positions on SUI.
The marked purple zone is the weekly demand zone, and I believe it should hold.
Additionally, we will be retesting the March 24 high for the first time, which likely has enough liquidity to create upward momentum.
Invalidation will occur if the $1.60 low is taken out aggressively.

SUIUSDTmy entry on this trade idea is taken from a point of interest below an inducement (X).. I extended my stoploss area to cover for the whole swing as price can target the liquidity there before going as I anticipate.. just a trade idea, not financial advise
Entry; $3.2230
Take Profit; $3.6817
Stop Loss; $3.0789

#SUI/USDT Analysis!📉 CRYPTOCAP:SUI took trendline liquidity and is heading toward the 4H +OB.
🚨 Watch for a tap into +OB—it could sweep PML $2.899 before a reaction.
🔹 Resistance: PMH $3.7379
🔹 Support: $2.899
👀 Patience is key!
