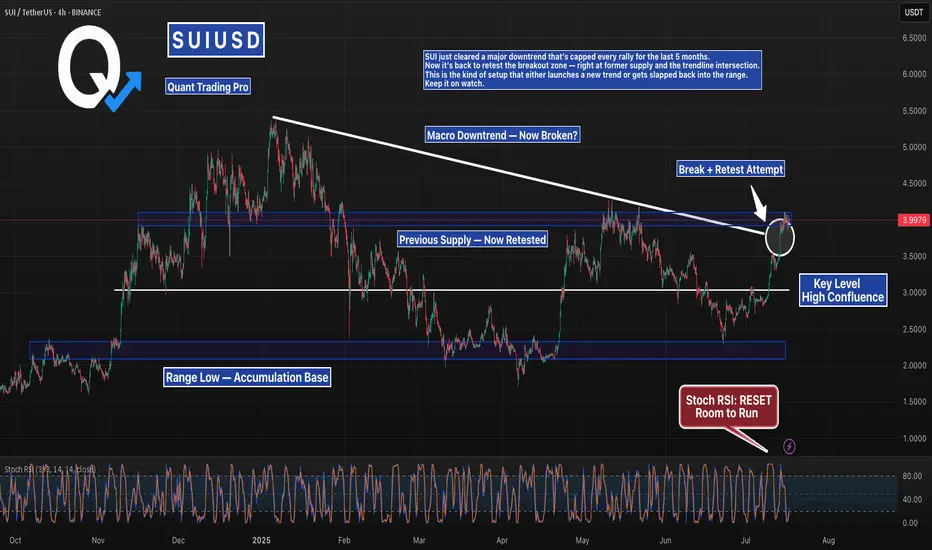
SUI Just Broke Its Downtrend — But Can It Hold?SUI just cleared a major downtrend that’s capped every rally for the last 5 months.
Now it’s back to retest the breakout zone — right at former supply and the trendline intersection.
This is the kind of setup that either launches a new trend or gets slapped back into the range.
Keep it on watch.
#SUI #SUIUSDT #CryptoBreakout #TrendlineTest #ChartAnalysis #BacktestEverything #TradingView #QuantTradingPro #CryptoTraders
SUIUSDT trade ideas
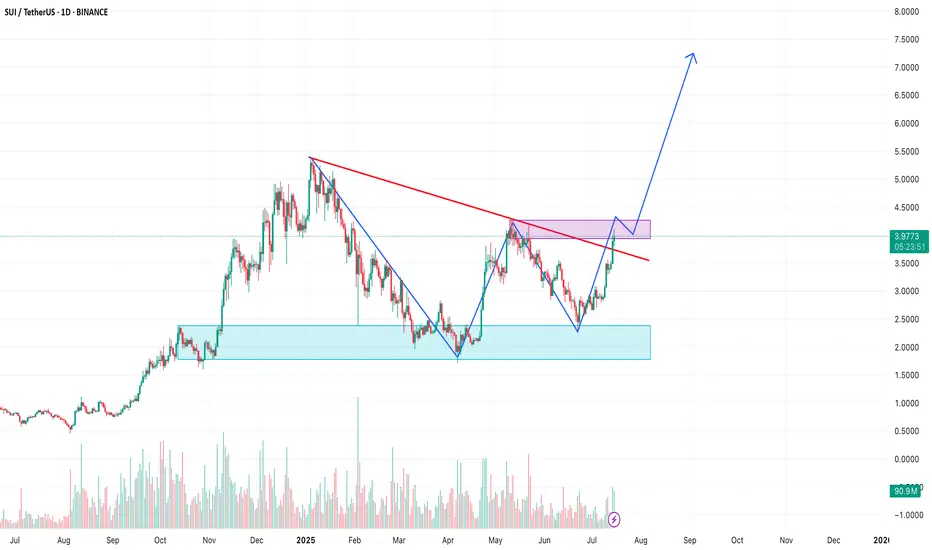
SUIUSDT Breaks Out of Triangle – Eyes on $10BINANCE:SUIUSDT daily chart has confirmed a breakout above a symmetric triangle resistance line within a larger ascending channel, signaling strong bullish momentum. Price has reclaimed the 100 and 200 EMAs, and the breakout is backed by rising volume. This setup opens the door for a potential rally toward the $10.00 level, with price currently holding above key structure support around $4.00. As long as this level holds, continuation toward the upper trendline remains likely. CRYPTOCAP:SUI

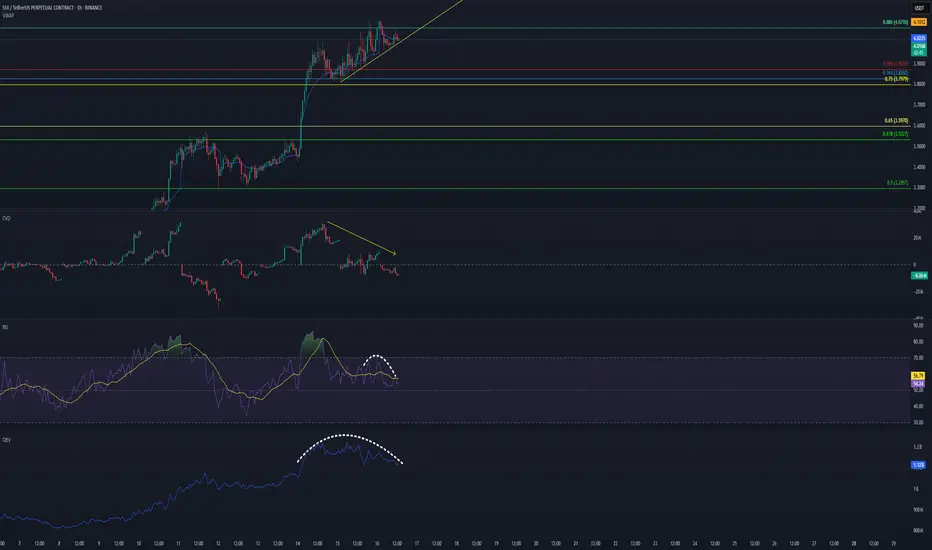
SUI‑USDT – Exhaustion or Extension?1. Why this zone matters
Price has reached the 0.886 Fib retrace of the May -> Jun swing.
Momentum is fading: 1‑hour RSI peaked lower (60 vs. 69 on the prior swing).
OBV and hourly volume both rolling over
2. Order‑flow snapshot (since 14 Jul 00:00 UTC)
Spot CVD → up Retail/FIAT buyers still lifting offers.
Perp CVD → down Aggressive shorts absorbing that demand.
Aggregated OI → up, now stalling Fresh longs trapped; beginning to unwind.
Interpretation: spot bids are being offset by short perps, and the build‑up in leverage is leaking—classic exhaustion.
3. Historical stats to know
The combo Spot CVD ↑ + Perp CVD ↓ + OI roll‑over + RSI bear‑div has produced a ≥ 1 % downside move within 30 minutes about 65 % of the time on tier‑1 alts (Jan 2023 – Apr 2025 sample).
4. Checklist before I short
M5 structure break (lower‑high plus close below the last M5 swing low).
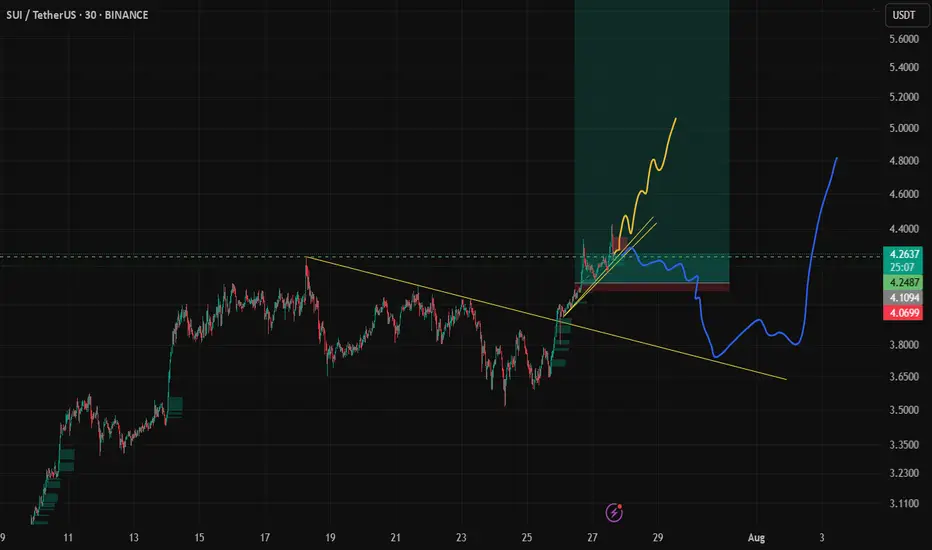
Need a 1H candle CLOSE below the yellow ascending trendline!
Perp CVD flips ≤ 0 and OI prints two consecutive down‑ticks.
TPO sell tail with at least 3 single prints right at the high.
If all three fire → short is live. Otherwise, stand aside.
Bottom line
Momentum is fading; spot buying is being soaked up by stealth perp shorts, and leverage is already leaking out. Wait for the checklist—then look for a mean‑reversion move lower.
And remember: Reaction beats prediction.
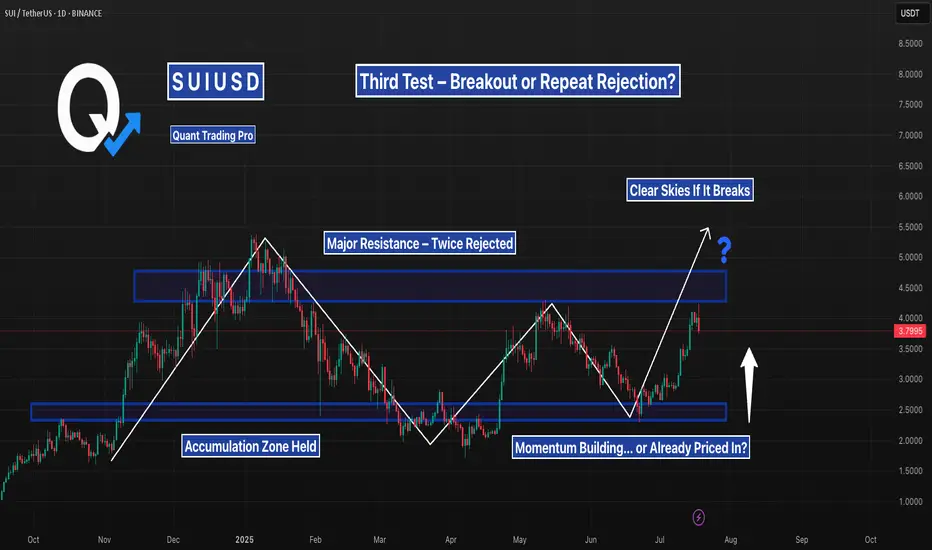
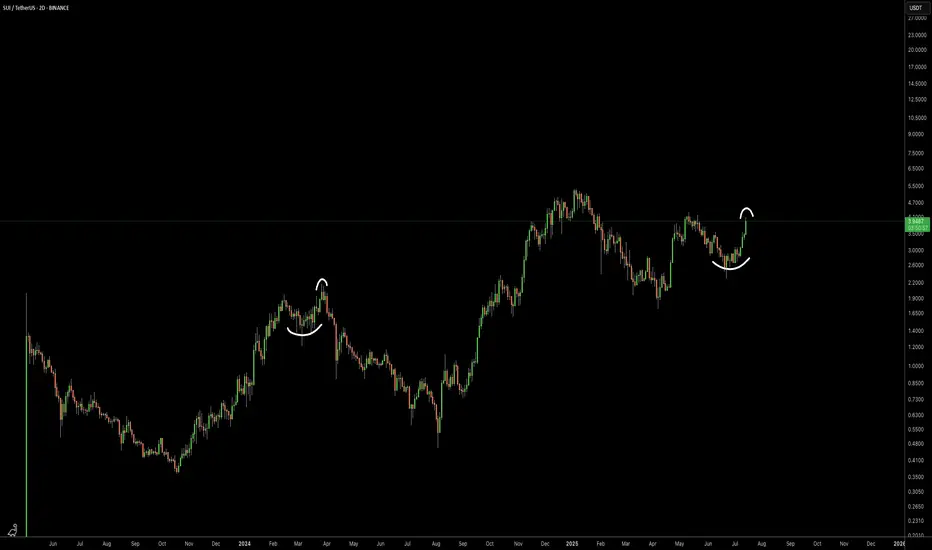
SUI Approaches Key Level Again…SUI has recovered sharply from range lows and is now staring down the same resistance that slapped it twice before. If momentum carries it through this time, there’s very little above. If not, this could be the last squeeze before a reset. Classic inflection point setup.
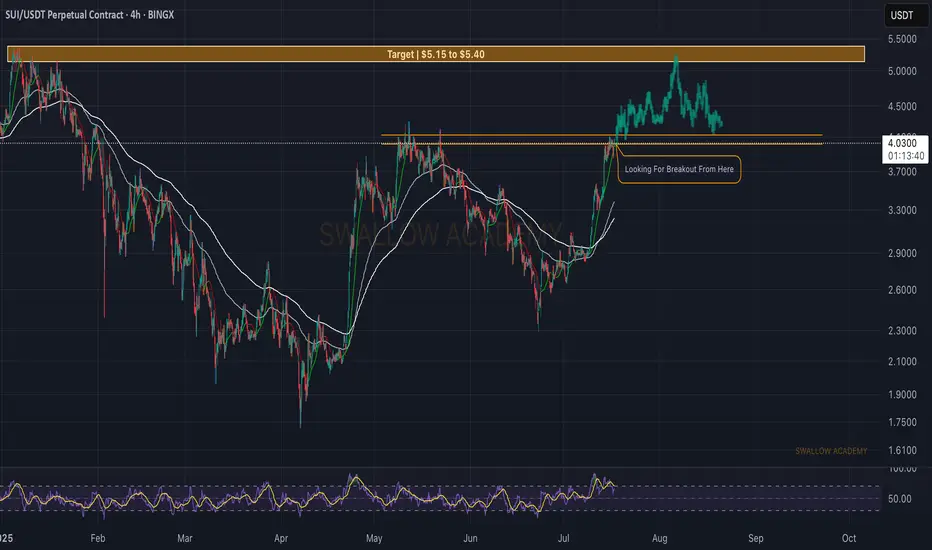
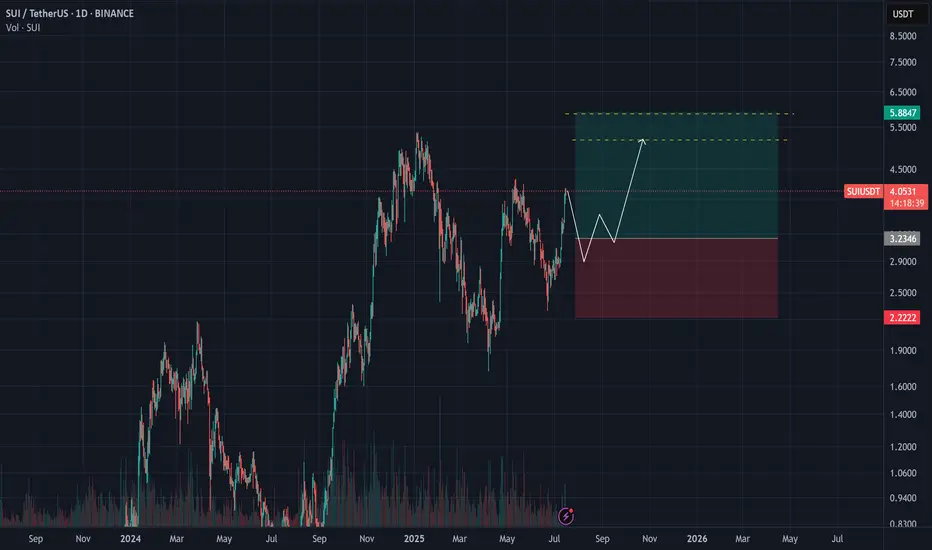
Sui (SUI): Looking For BOS (Break of Structure) Sui coin looks strong, where we are about to get a proper BOS (Break of Structure), which then would give us an ideal opportunity for a long position up until $5.40, where our target is sitting currently.
Once there we expect to see some sort of correction or sideways movement, before next wave of upward movement.
Swallow Academy
Sui and manipulation.In my opinion, this rally is a manipulation, and we’ll see a sharp correction in the near future.
SUI is breaking out – Time to buy again.SUI is now breaking above the descending trendline. The price is approaching a key resistance zone around $4.10–$4.20. A successful breakout and retest could open the door to a strong bullish continuation.
💬 What do you think?
Drop your thoughts ⬇️
#SUI #CryptoTrading #Breakout #Altcoins #TechnicalAnalysis
SUI - Breakout of the year- SUI is currently trading near the resistance line. Price was reject around this resistance line in the previous pump.
- Given the current bullish market, price is expected to breakout from this resistance easily
Entry Price: 4.04
StopLoss: 3.2
TP1: 4.5059
TP2: 5.3810
TP3: 6.5106
TP4: 7.8772
TP5: 10+
Don't forget to set stoploss.
Stay tuned for more updates
Cheers
GreenCrypto

Will key support be held or broken today?Hello friends
According to the complete analysis we conducted on this currency, we concluded that the price correction can continue with the failure of the specified support and go to lower supports, but if buyers support the price in the support area, it can have a good rise.
Note that with capital and risk management, you can buy in steps in the specified support areas and move with it to the specified targets.
*Trade safely with us*

SUI Swing Buy / Long SetupSui is on Strong and decision Order block on 1 day Timeframe, If we break this then SUI will take correction till recent weekly low. If we hold this then new ath. Book some or 80% on mentioned area, rest hold till 6$.

SUI Price Idea
Be Carefull and Full Patient on SUI today because if the price break and closing under Choch Line the probability to go down is possible, but if break the line without closing below the line we can wait for the choch on the low Time Frame for buy opportunity
#staysafu

SUI / USDT : Looking bullish SUI/USDT chart shows a breakout from a descending trendline, confirming upward momentum. Current price tests the resistance zone around $4.00. BTC is receiving support from the FVG, indicating short-term bullish potential.
Bullish Scenario: If price breaks above the resistance zone, a rally towards $4.50 to $5.00 is possible. Watch for confirmation of higher highs on shorter timeframes.
Invalid Setup: If price fails to break the resistance and falls back below $3.50, the bullish setup would be invalidated.
Pro Tip: Always wait for a clear confirmation candle above the resistance zone before entering a trade to minimize risk.

Sui (SUI): Targeting $4.20 | Bullish ScenarioWe are seeing the possibility for upward movement here, which could result in +20% of market price movement from our entry.
As of now it is too early yet to talk about any bullish movement here so we are waiting patiently for a proper breakout from our entry area, which would then give us a proper chance for bullish movement from there.
Swallow Academy

Long SUISUI had broken the 1D resistance of a Cup & Handle pattern.
Long setup is as in chart.
Disclaimer:
This analysis is based on my personnal views and is not a financial advice. Risk is under your control.

SUI RETESTING THIRD IMPULSE HIGH - 2 SCENARIOSSUI could come back down to retest the trendline break. It has just retested the third impulse high. Set up is still valid. Respecting the trendline(s) for the time being. 2 scenarios could play out - higher or lower...hahaha.
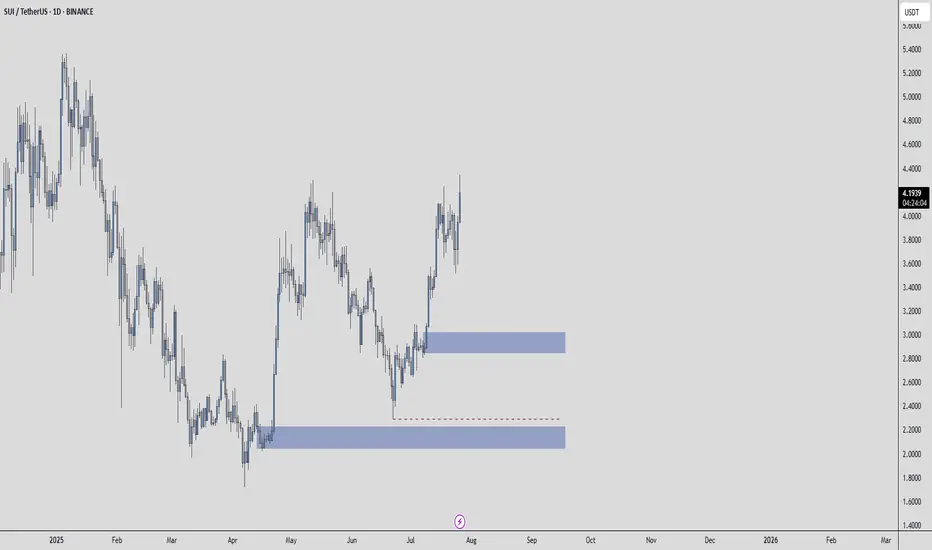
SUIUSDT – A Setup Worth WatchingThe blue box isn't just a zone, it’s a place where value and timing intersect.
🟦 Context
If price enters this area with control:
It aligns with past volume cluster support
A clean 1H break and confirmation may unlock high R:R potential
Structure + patience = confidence
📌 Execution Plan
🧭 No need to predict.
Just observe:
✅ Does the blue box hold with absorption or slowdown?
✅ Does CDV remain constructive?
✅ Does the 1H chart break and confirm direction?
If yes, there’s asymmetry on your side.
And that’s when smart trades happen.
"It’s not about being early. It’s about being right when it matters."
— And that starts with a prepared eye and a defined plan.
📌I keep my charts clean and simple because I believe clarity leads to better decisions.
📌My approach is built on years of experience and a solid track record. I don’t claim to know it all but I’m confident in my ability to spot high-probability setups.
📌If you would like to learn how to use the heatmap, cumulative volume delta and volume footprint techniques that I use below to determine very accurate demand regions, you can send me a private message. I help anyone who wants it completely free of charge.
🔑I have a long list of my proven technique below:
🎯 ZENUSDT.P: Patience & Profitability | %230 Reaction from the Sniper Entry
🐶 DOGEUSDT.P: Next Move
🎨 RENDERUSDT.P: Opportunity of the Month
💎 ETHUSDT.P: Where to Retrace
🟢 BNBUSDT.P: Potential Surge
📊 BTC Dominance: Reaction Zone
🌊 WAVESUSDT.P: Demand Zone Potential
🟣 UNIUSDT.P: Long-Term Trade
🔵 XRPUSDT.P: Entry Zones
🔗 LINKUSDT.P: Follow The River
📈 BTCUSDT.P: Two Key Demand Zones
🟩 POLUSDT: Bullish Momentum
🌟 PENDLEUSDT.P: Where Opportunity Meets Precision
🔥 BTCUSDT.P: Liquidation of Highly Leveraged Longs
🌊 SOLUSDT.P: SOL's Dip - Your Opportunity
🐸 1000PEPEUSDT.P: Prime Bounce Zone Unlocked
🚀 ETHUSDT.P: Set to Explode - Don't Miss This Game Changer
🤖 IQUSDT: Smart Plan
⚡️ PONDUSDT: A Trade Not Taken Is Better Than a Losing One
💼 STMXUSDT: 2 Buying Areas
🐢 TURBOUSDT: Buy Zones and Buyer Presence
🌍 ICPUSDT.P: Massive Upside Potential | Check the Trade Update For Seeing Results
🟠 IDEXUSDT: Spot Buy Area | %26 Profit if You Trade with MSB
📌 USUALUSDT: Buyers Are Active + %70 Profit in Total
🌟 FORTHUSDT: Sniper Entry +%26 Reaction
🐳 QKCUSDT: Sniper Entry +%57 Reaction
📊 BTC.D: Retest of Key Area Highly Likely
📊 XNOUSDT %80 Reaction with a Simple Blue Box!
📊 BELUSDT Amazing %120 Reaction!
📊 Simple Red Box, Extraordinary Results
📊 TIAUSDT | Still No Buyers—Maintaining a Bearish Outlook
📊 OGNUSDT | One of Today’s Highest Volume Gainers – +32.44%
📊 TRXUSDT - I Do My Thing Again
📊 FLOKIUSDT - +%100 From Blue Box!
📊 SFP/USDT - Perfect Entry %80 Profit!
📊 AAVEUSDT - WE DID IT AGAIN!
I stopped adding to the list because it's kinda tiring to add 5-10 charts in every move but you can check my profile and see that it goes on..

SUIUSD @ Retest Zone | Breakout Setup?SUI is consolidating in a potential bull flag above the previous resistance zone around $4.00.
Stoch RSI is low, trendline support is still intact, and a clean R:R setup presents itself with TP at $4.40 and SL at $3.80.
Watching for volume breakout confirmation before entry.
#SUIUSD #BullFlag #Crypto #SupportResistance #BreakoutSetup #TradingView #QuantTradingPro

SUI Analysis – July 15, 2025
SUI appears to have entered its bullish phase slightly earlier than most other altcoins.
This move seems to be fueled by a number of key partnerships and contracts signed over the past six months — a fundamentally positive signal.
📊 However, based on the current chart structure,
entering at this level may not be the most attractive opportunity.
✅ While a short-term 20% upside could be possible,
it’s more prudent to wait for price to test its previous high,
and observe how investors react to that resistance zone.
Their behavior will offer clearer insight into whether a continuation or correction is likely.
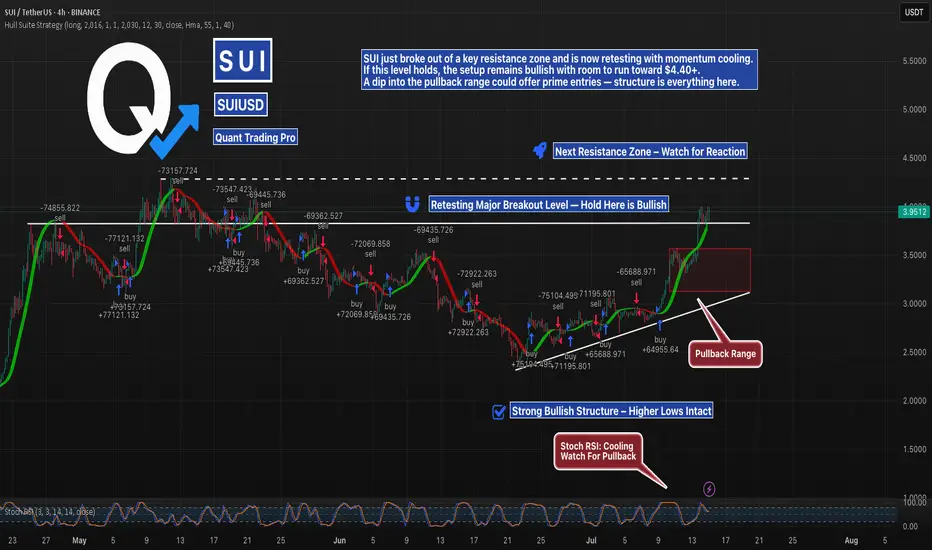
SUI Breakout Retest in Progress — Bulls Have the BallSUI has finally broken above major horizontal resistance and is now retesting that level, backed by a rising trendline of higher lows. With Stoch RSI cooling and the price sitting just above a prior range, this is the key decision zone.
If bulls defend the breakout, continuation toward $4.40+ is likely. If not, the pullback zone between $3.50–$3.00 becomes critical. Structure still favors the bulls — but confirmation is everything.
#SUIUSDT #CryptoBreakout #QuantTradingPro #TradingView #BacktestYourEdge #AltcoinSetup
SUI - Daily Chart PerpectiveThis chart is in expansion to our previous post:
What we can see is SUI has clearly broken out of its symmetrical triangle (yellow trendlines). This is the first good sign for potential new highs for SUI.
However since the 4H chart could be spelling out a short term drop lets see where price could go.
Right now it is testing the 0.618 of the macro trend as resistance. It could also be battling with the top range of wick price action (dotted white lines).
If price does fall on the 4H chart it could coincide with a retest of our yellow trendline.
If we get a retest and hold of that yellow trendline that will be the confirmation we need for a full blown breakout for SUI.
If we do not fall on the 4h chart and break back above the $4 level then price will head to the 0.786 ($4.60) followed by a test of the previous high.

SUI 50% correction to $1.50 areaOn the above 3 day chart price action has moved up 700% since last August. A number of reasons now exist for a reversal, they include:
1) Broken market structure.
2) Price action and RSI support breakouts.
3) A reliable bearish crossover.
4) No support levels until 1.90. A strike of 1.50 is probable.
5) "Short" active from $4.05 area.
Is it possible price action continues printing higher highs? Sure.
Is it probable? No.
Ww

SUIUSDT Weekly Chart Analysis | Breakout Confirmed!SUIUSDT Weekly Chart Analysis | Breakout Confirmed, Massive Liquidity at $4–$4.20
🔍 Let’s dive into the SUI/USDT weekly chart after a decisive breakout from the symmetrical triangle, highlighting the critical liquidity zone and what it means for price action.
⏳ Weekly Overview
SUI has broken out of its multi-month triangle pattern following a textbook fakeout, with volume dynamics confirming renewed bullish momentum. The breakout is now awaiting daily candle confirmation for full validation.
🔺 Bullish Breakout & Key Liquidity Zone
A major liquidity cluster sits between $4.00 and $4.20, with more than $140 billion in liquidity concentrated in this range. This zone is crucial for several reasons:
- It represents a significant area where large buy and sell orders are stacked, likely leading to heightened volatility as price approaches or breaks through.
- Clearing this liquidity could unlock rapid moves toward the next upside targets at $7.03 and $9.50, as shown on the chart.
📊 Key Highlights
- Symmetrical triangle resolved with a bullish breakout, confirmed by increasing volume.
- The $4.00–$4.20 range holds over $140B in liquidity, making it a pivotal battleground for bulls and bears.
- Daily candle confirmation remains essential for trend validation.
- SUI ecosystem has reached a new all-time high in DeFi TVL, adding fundamental strength to the bullish case.
🚨 Conclusion
The breakout above the triangle, combined with surging volume and a record DeFi TVL, sets the stage for a potential rally. Watch the $4.00–$4.20 liquidity zone closely—how price interacts with this level could determine the speed and magnitude of the next move. Stay alert for daily confirmation and be prepared for volatility as SUI tests this high-stakes region.
#SUI #CryptoAnalysis #TradingView #Altcoins #ACA
