SUI Outlook for December 2024Market Overview
BINANCE:SUIUSDT.P is currently trading near $4.16, showcasing moderate volatility. Below is a concise technical analysis:
Bullish Momentum:
The price recently tested a high of $3.94, supported by trading above key moving averages (MA7 and MA25), indicating positive momentum.
If support levels between $3.1–$3.4 hold, the pair could target resistance at $4.0–$4.2 and potentially extend gains toward $4.5–$5.0.
Downside Risks:
The pair has faced strong resistance near $3.94. Continued rejection at this level could lead to a decline toward the major support at $3.1 or further down to $2.5.
A break below the MA25 could intensify selling pressure, targeting $2.1 as the next significant support.
December 2024 Outlook:
Bullish Scenario: If SUI maintains its position above $3.4 with increased trading volumes, a rally toward $5.0 is possible.
Bearish Scenario: Failure to hold critical support may result in a decline to the $2.5–$3.0 range.
Recommendations:
Monitor trading volumes and support levels near $3.1 for clearer buy or sell signals.
Combine technical analysis with ecosystem updates to make informed decisions.
Note: Implement robust risk management strategies to navigate market fluctuations effectively.
SUIUSDT trade ideas


Price Analysis: Key Support and Resistance LevelsBINANCE:SUIUSDT.P is currently trading within a range of $3.96-$4.02, with strong resistance at $4.10 and key support at $3.90. Technical indicators such as RSI reflect a balance between buying and selling forces, suggesting a neutral momentum. Moving averages indicate ongoing bearish pressure in the long term, while the MACD shows weak momentum. A breakout above $4.10 could push the price toward $4.25, whereas a breakdown below $3.90 may lead to declines toward $3.75. Caution is advised when trading, with clear stop-loss levels to manage risk effectively.

SUIUSDT Support and resistance levelSUIUSDT chart analysis for a client based on support and resistance
possible targets are shown based on S&R only

SUIUSDT SUIUSDT-DT
chart shows good HH-HL and upward momentum,
for short term profit area is 5.49 and 6.94 which can get 37% and 63% gain
from current level, stoploss is at 2.8

$SUI GO TO MOON BUT TAKE A LONG FIRSTtake a long with capital managment on Sui coin and go to sleep . this Coin have a big chance to be in top10 . just take a long or invest on it as spot . Sui will Go to moon . All targets and stop loss on the chart . good luck guys

A similar behavior Between ID and SUIStructurally these charts are almost identical
- Same low and higher low
-same rounding bottom pattern
Accumulate ID while its price is low.
It will become a trend and the talk of everyone as soon as it breaks the round bottom pattern just like what happend with SUI
Best regards Ceciliones🎯

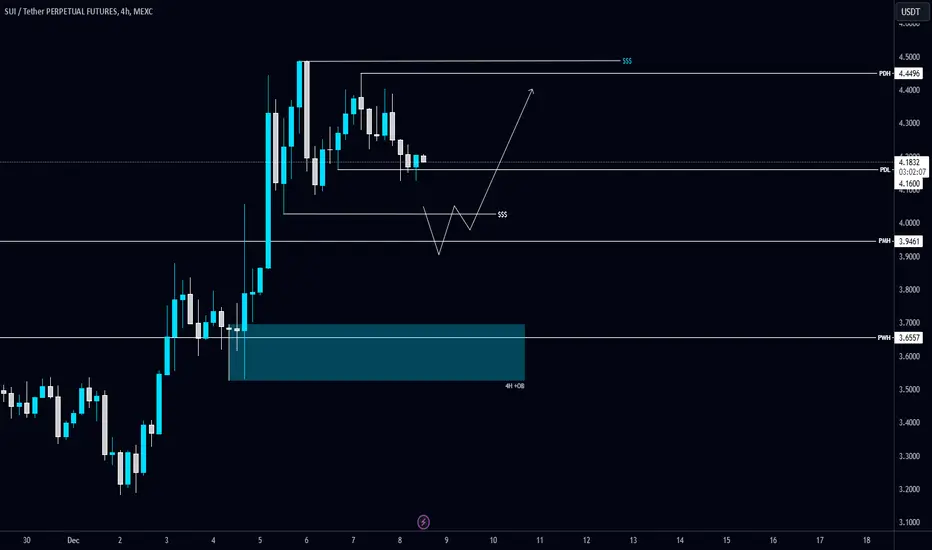
Waiting #SUI/USDT to take this Sell-side LiquidityWaiting #SUI/USDT to take this Sell-side Liquidity before Buy-side Liquidity.
If CRYPTOCAP:SUI swept and didn't retrace back, it can revisit the 4H +OB. The local support level is PMH $3.9461.
Waiting #SUI/USDT to take this Sell-side Liquidity before Buy-siWaiting #SUI/USDT to take this Sell-side Liquidity before Buy-side Liquidity.
If CRYPTOCAP:SUI swept and didn't retrace back, it can revisit the 4H +OB. The local support level is PMH $3.9461.

#SUI. Corrections = Opportunities – Plan Ahead! 11/29/24Local market corrections are inevitable, and they present excellent opportunities to find strong entry points.
After securing 6x returns on #SUI, the euphoria has started to fade, and retail traders are being gradually calmed down, leading to the local pullbacks we’re now seeing for #SUI.
Accumulation on spot and opening swing positions should be considered in the $3.2 - $2.8 range, with an initial target of $4. After that, in my view, the price might dip to the $2.0 - $1.6 range before the true rally begins.
DYOR.

SUI Update As long as the price doesn’t drop below the bottom of the specified range box, we can expect SUI to break out and reach the $5 level.
good luck guys !

SUI or SOL, $5 or $300? You to Choose!SUI or SOL? WHat to?
As you could see in the previous chart for SUI, DITTO worked as doodled!
SO the Plans of the trade are as such, On days chart, The resistance are at such a juncture point that when short is happened thats the ideal point to buy. But as always, shall it has some power to fuel up, can go to approx 4.75 and then fall, so Ideally if CMP buying targets till 5. My ideal point of buys goes at 3.596 the red lines, so would take a hedged position of long first and short next. Going for BUYS to CMP and would trail SL to COST whenever possible.
What you can do? Take shorts to hold till the point, or wait for it to come to buy

SUI hits a new ATH. Again. With a strong positive breakout from its bullish flag pattern in the daily time frame, the Sui token has achieved a new all-time high of $4.47 with a trading volume of $4.58 billion, a change of +78.77%. This indicates increased bullish sentiment for the altcoin.
The Moving Average Convergence Divergence (MACD) displays a rising green histogram with its averages recording a bullish convergence in the daily time frame. This highlights an increase in the buying sentiment for this altcoin in the crypto market.
On the other hand, the SMA indicator constantly acts as a support to the SUI price chart. Reportedly, this indicates a strong bullish price outlook for the Sui token in the upcoming time.
Maintaining the price above its support level of $4 could set the stage for this altcoin to head toward its $4.75 mark. Moreover, if the bullish sentiment intensifies, this could push the price toward its higher price target of $5.5 this month.
However, if a bearish reversal occurs, the Sui crypto price may retest its support level of $4.00. Furthermore, if the bearish momentum intensifies, this could pull the price of this altcoin toward its lower support trendline of $3.250.

SUI LONG H4Sui is a first-of-its-kind Layer 1 blockchain and smart contract platform designed from the bottom up to make digital asset ownership fast, private, secure, and accessible to everyone. Its object-centric model, based on the Move programming language, enables parallel execution, sub-second finality, and rich on-chain assets. With horizontally scalable processing and storage, Sui supports a wide range of applications with unrivaled speed at low cost. Sui is a step-function advancement in blockchain and a platform on which creators and developers can build amazing, user-friendly experiences.

SUIUSDTWe can attempt to buy SUIUSDT from specified level as it makes HL , also 0.618 FIB level intact indicate that it moves upward.
SL , TP mention in chart

SUIUSDT jump
📈 SUIUSDT Trend Analysis 🚀
Looks like SUI just broke through a major resistance level at $1.9740! 🔥 This breakout could signal a bullish continuation 📈, especially if it holds above this level. The next profit targets are marked around $4.4444 and $7.7002 💰 – good spots for traders to consider locking in profits.
📝 Key Tips:
Follow the trend as long as support holds.
Stick to money management rules to protect your gains 🛡️.
Let’s see if SUI can reach those higher levels! 🤑💪

SUI TARGETS ALL TIME HIGHS - SUI NETWORK LONG IDEAThe price ran the daily swing liquidity but failed to close below, showing a strong rejection after the liquidity grab. It created a 4H demand zone, and the price tested this zone with another strong rejection. Recently, we broke the bearish trendline, followed by a retest.
I entered the trade at the trendline bounce and am targeting new highs.
SL: $2.97 (Daily close below)
TP: $3.95 (ATH)

Elliot wave pattern on Sui.Im new to trading, but it looks like Sui is on a path to $8. What are your thoughts? Also, it looks as if we are about to go to levels on the Usdt.d chart that we haven’t seen in a while. #altseason

Where To Buy SOL MartyBoots here , I have been trading for 17 years and sharing my thoughts on SOL here.
SOL is looking very good here as it builds pressure before this next move up, very strong chart for more upside
Very similar to SUI which is up 30% + this week
Do not miss out on SOL as this is a great opportunity
Watch video for more details

Sui hits $4 ATH. What's next?Sui has been gaining significant attention from investors. Riding the wave of Bitcoin’s new all-time high, Sui also reached record levels. Since the U.S. election, the altcoin has surged by an impressive 118%, setting a new all-time high.
Sui has delivered remarkable returns of 760% since August, placing it among this year’s best-performing altcoins. Over the past month, it has traded within a tight range of $1.84 to $2.37. However, during the U.S. election, Sui broke out, climbing alongside Bitcoin and other altcoins. A few hours ago, it reached a new peak of $4.04.
Despite this milestone, Sui’s momentum has slowed, with minimal price changes since. On the daily chart, the Relative Strength Index (RSI) is at 74.32, suggesting bullish sentiment. Similarly, the Average Directional Index (ADX) has climbed to 23.28, indicating the potential for further gains.
While technical indicators remain positive, the trading volume tells a different story. Daily volume has fallen by 13.27% compared to the previous 24 hours. Despite this, Sui’s price has risen by 2.39% and is currently trading at $3.84.
Sui has been a top performer this year, delivering exceptional returns. However, with investors beginning to take profits, selling pressure may lead to a correction. Key support levels to watch are $3.19 and $2.90, with stronger support at $2.30 if the decline intensifies.
On the other hand, if Bitcoin continues its rally and draws more buyers into the market, Sui could defy expectations and surpass its recent all-time high.

SUI has more potentialShown on the 12 hour here, SUI I believe has more potential.... based on the current news narratives. VanEck just added SUI to two European funds. I think SUI will pump up from the short squeezes...
