SUI near ATHSUI nearly made it to ATH. I know it looks pretty scary to enter long that high, and that makes sense. But I want you to check out SUIBTC chart - imagine that price break above that level - in this case guaranteed target will be around 0.00009 and that makes another 150% from breakout (or ~180% from cmp) 👀
Watch the dips under 1.92 and down to 1.85 - they can be an opportunity to catch that breakout.
SUIUSDT trade ideas

SUI - Possible Pullback to $1.20 to $1SUI Network skyrocketed and has recently been the most hyped coin.
In our last update, we anticipated a breakout when it was trading around $1
SUI has just undergone 83 million USD worth of token unlocks.
Technical Outlook:
With CRYPTOCAP:BTC dominance rising as Bitcoin corrects, we expect a broader pullback.
On the weekly timeframe, price has hit a significant resistance level.
4-hour timeframe: There was a strong rejection, and it is now trading around the daily Point of Control (dPOC). If it loses the monthly Point of Control (mPOC) at $1.70, there is a higher chance it will revisit the $1.20 to $1 (breakout area)

SUI potential playout !SUI / USDT
massive breakout of downtrend line
When an altcoin shows Such strength very likely to continue
A Potential playout of upward movement to high range of big channel
Best of wishes

Sui idea Seems to me on the weekly is very bullish as soon as it takes out 2:17 all time high will be on the way . Solana might have a new competitor on the Meme coins , so am buying some sui and let it ride. Also last month they partner Usdc for transactions even tho is a meme coin i think it can go higher . Not an advise

#SUI (SHORT) entry range(2.0844- 2.2500) T.(1.1421) SL(2.3300)I will take this risk to short BINANCE:SUIUSDT from this price (2.0844), please do your own plan....
BINANCE:SUIUSDT
entry range (2.0844- 2.2500))
Target1 (1.4590) - Target2 (1.1421)
SL (2.3300)
*** I will take this risk , please do your own plans ***
*** No FOMO - No Rush , it is a long journey ***
**** #Manta ,#OMNI, #DYM, #AI, #IO, #XAI , #ACE #NFP #RAD #WLD #ORDI #BLUR #SUI #Voxel #AEVO #VITE #APE #RDNT #FLUX #NMR #VANRY #TRB #HBAR #DGB #XEC #ERN #ALT #IO #ACA #HIVE #ASTR #ARDR #PIXEL #LTO #AERGO #SCRT #ATA #HOOK #FLOW #KSM #HFT #MINA #DATA #SC #JOE #RDNT #IQ #CFX #BICO #CTSI #KMD #FXS #DEGO #FORTH # AST #PORTAL #CYBER #CLV #RIF ENJ #ZIL #APT #MAV #ZRX ****

SUI at Risk: Bearish Momentum and Key Levels to Watch!Yello, Paradisers! Is SUI heading for another leg down, or will it surprise us with a breakout? Here's our take.
💎SUI is showing strong bearish momentum right now as it faces a key supply area. One of the main signals confirming this is the bearish divergence on the RSI indicator, which often indicates a potential price drop. If SUI gets rejected again (as it did previously), there’s a good chance it will revisit the 1.7180 demand zone, possibly giving us a short-term rebound before continuing its downward journey toward the 1.6 support level.
💎This 1.6 area is crucial because a break below this zone would validate a double-top pattern, suggesting a significant bearish move. Should this happen, we could see SUI targeting the Bullish OB at the 1.24 level.
💎However, if SUI breaks out above its All-Time High (ATH) at 2.18 and closes the day above it, this will invalidate the bearish setup. Such a breakout would signal a bullish continuation, and we’d expect prices to push higher. In that case, it would be wise to close any short positions on SUI, as the trend could shift significantly.
Discipline, patience, and strategic positioning are key here.
MyCryptoParadise
iFeel the success🌴

#SUI/USDT#SUI
The price is moving in an ascending channel on the 1-hour frame upwards and is expected to continue.
We have a trend to stabilize above the 100 moving average again.
We have an upward trend on the RSI indicator that supports the rise by breaking it upwards.
We have a support area at the lower limit of the channel at a price of 1.70.
Entry price 1.75.
First target 1.87.
Second target 1.94.
Third target 2.00.

SUI done? or...If you find this information inspiring/helpful, please consider a boost and follow! Any questions or comments, please leave a comment!
Finally have a bit of a break of the HL.
IF it is ready for a Wave 4.
I would really like to see a move down to 1.45 and react before a move back to 2$, to load a long.
Still time to put in a wave B so may not be ready yet.
Trade Safe,
Trade Clarity.

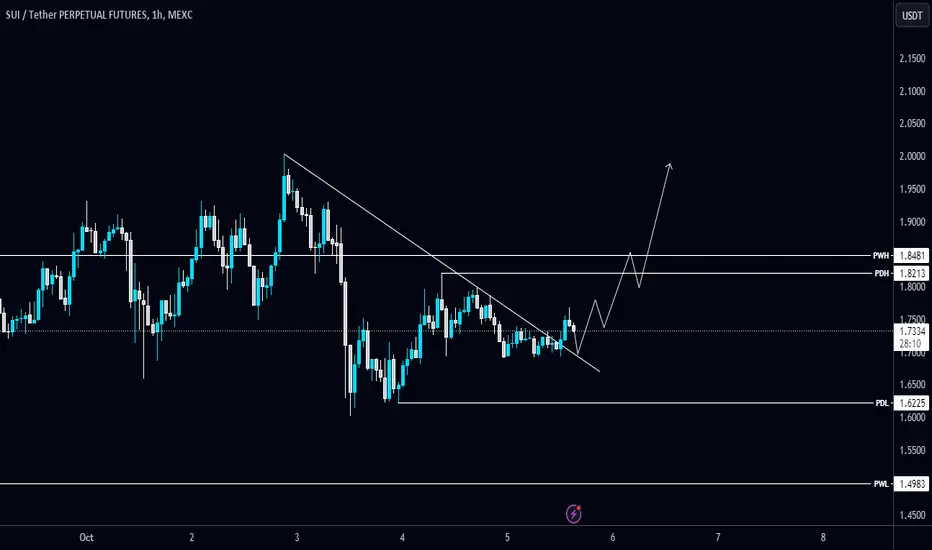
#SUI/USDT breaks the Diagonal Trendline in 1-Hour TF!#SUI/USDT breaks the Diagonal Trendline in 1-Hour TF!
Wait for a successful retest to long $SUI. The local support level os PDL $1.6225. #SUIUSDT's local resistance level is PHW $1.8481.
$Sui where to!I think we are in wave 4, retracing to 0.618, 0.5 or 0.382 to start wave 5 for a double top or beyond.. Good luck for everybody. dor.. this not a financial advice.

DreamAnalysis | SUI Coin Analysis Key Spot and Futures Triggers📊 Welcome to Today's Analysis!
Today, we're diving into the SUI coin, exploring its potential and sharing key entry and exit triggers for futures trading. Let’s get started!
🚀 Overview of SUI Coin:
The SUI coin operates within the blockchain and DeFi sectors, and it has recently garnered significant hype. This excitement is clearly reflected in its chart, indicating strong market interest.
📈 Daily Timeframe Analysis:
In the daily timeframe, after breaking the trigger at 1.0193, the price has experienced substantial growth and has now reached resistance at 1.8339. Currently, the price is consolidating just below this resistance level.
🔄 Next Steps:
I believe the price will wait for the SMA25 to align with the candles before any momentum enters the market. If it breaks through 1.8339, we could consider both long futures positions and spot purchases.
If momentum doesn’t materialize, the price may correct to the 0.382 Fibonacci level, which coincides with 1.4324, before initiating its next movement. As long as the price maintains higher highs and higher lows in the daily timeframe, I view the trend as bullish and will refrain from selling in the spot market. The most critical support level for SUI is at 0.7562.
🛒 Spot Buying Triggers:
In addition to the 1.8339 trigger, I prefer the more reliable trigger at 2.1325 for spot purchases, while opening a futures position at the first trigger. The RSI entering the overbought zone will provide additional confirmation for both triggers.
⏱️ 4-Hour Timeframe Analysis:
In the 4-hour timeframe, the weakness of the bullish trend is quite evident. After breaking 1.4324, the volume has decreased significantly. Following this, there was a notable rejection at resistance 1.9009, and the price is currently resting after reacting to the 1.6260 range.
⚠️ Short Position Considerations:
Breaking the trigger at 1.9009 is a viable but risky option for a short position. Given the ongoing bullish trend in the daily timeframe, the risk of hitting a stop loss is high. We could consider opening a primary short position after breaking 1.4324. A break below 44.43 in the RSI could confirm the entry of bearish momentum.
🌟 Long Position Opportunities:
For a long position, breaking 1.9009 presents an excellent opportunity. I aim to open a long position after this resistance is broken. The next trigger for a long position is 2.1325, which I believe is more suited for spot trading, as opening a futures position may prove challenging.
🔍 Conclusion:
Stay vigilant with your trading strategies and keep an eye on these key levels as we navigate the market! Happy trading!
⚠️ Disclaimer:
This information is for educational purposes only and does not constitute financial advice. Always conduct your own research and consult a licensed financial advisor before making any investment decisions.

will short SUI here clear invalidation and clear risk reward Here i have SUI with clear invalidation. Clear risk and reward if it plays out. we never know it play out 100 percent but when we have clear risk reward like this its good. I will take with clear risk reward.

SUI uptrend endAs can be seen from the 4H chart, SUI has diverged
At the same time, it also reached the previous high point.
And the retracement fell below the previous low of 1.65
So I think this is the end of this rally.
Next, the short side should be the main one
If it falls below the low of 1.59 of this retracement
Then TP1 is placed at 1.48
If it does not fall below
And a new consolidation is formed in this area
You should go out first and observe what happens next.
Wait for a new trend to form before continuing to operate
#The cryptocurrency market has high risks, please carefully evaluate operational risks
This analysis is a personal comment and does not constitute any investment advice, so please refer to it with caution.

sui can go down Based on this pattern and also checking other data, I think it can fall to the range of 1.32


SUI PriceOn the daily chart, SUI crypto price witnessed a notable rise of over 110% in the last three weeks. The price action indicates buyer accumulation and signals a positive market sentiment.

SUI ShortFirst time i was wrong but this time i wont be. SUI is overpriced as i told you in my previous idea. SUI must fall somewhere between 1.6 - 1.5.

Late Longs Will Punish Hard👉 Every Trend Have a Correction And For SUI Its Time To Take a Rest And Some Correction
📉 Ending Diagonal Formed At The Chart And The Price Rejected From The 1.93$ Top Two Times And Made a Double Top, Expect a Corrective Move To The 1.7$ As a Next Support Area

Sui price skyrocketed 140% in September: is ATH possible?Sui (SUI) Price, a Layer 1 blockchain token, has seen a significant uptick in market valuation recently. Despite broader market downturns, the SUI price has surged over the past week. This increase positions SUI holders advantageously as optimism in the altcoin sector rises, potentially setting the stage for a robust October rally.
Following the launch of its mainnet, the Sui Foundation introduced the Sui Bridge. This new feature enhances connectivity between the Ethereum and Sui networks by enabling secure asset transfers. This development is anticipated to draw new users and boost liquidity, further propelling Sui’s growth trajectory.
The SUI price has steadily climbed over the past 24 hours, as shown in the chart. At the time of reporting, the SUI price stands at $1.87, marking a 5% increase for the day.
The coin has encountered a notable barrier at the $2 level. Market conditions could soon favor an increase towards this mark. A rise to $2.18 would equal its peak from six months ago on March 27, 2024. Such a development could lead to a nearly 15% increase from its current level.
The Moving Average Convergence Divergence (MACD) indicates a potential shift in momentum. The MACD line converges towards the signal line, suggesting that a bearish crossover might be imminent. This is underscored by the histogram moving into the red zone, a sign that bears may be gaining strength.
Sui’s impressive price surge, growing TVL, and increased investor confidence signals strong potential for further gains. However, technical indicators suggest caution, as market conditions could shift. A move past $2 may set the stage for new highs

SUI/USDT UptrendSUI/USDT is currently in an uptrend, supported by the ascending trendline and EMAs.
SUI is currently in a consolidation phase above the EMAs (Exponential Moving Averages), which have been acting as strong support. The MACD is showing signs of consolidation. The MACD lines are getting closer, suggesting a possible bullish crossover. The histogram, with bars close to zero, reinforces that the market is in a moment of indecision. It is important to wait for a clear MACD crossover to confirm a new direction.
Support: 1.8125 / 1.7204
Resistance: 1.9341 / 2.0125

SUI Recovery in Play: Targeting $1.44 After Key BreakoutAfter reaching an all-time high (ATH) above $2 at the end of March, SUI entered a correction that pushed the coin below the key $1 level, reaching a low just under $0.50 on August 5th. However, SUI quickly recovered, and by August 8th, the SUI/USDT pair had broken above the falling resistance line of the channel, hitting a high above $1 on August 12th.
Following this move, the coin consolidated below this critical level, forming a clear higher low around the $0.75 zone. Currently, SUI is trading back above $1, sitting just below an important technical resistance. A breakout above this resistance appears imminent, with the first target for further upside being $1.44, representing a potential 40% rise.
Looking further ahead, if the broader crypto market continues to show optimism toward the end of the year, SUI could potentially retest its previous ATH above $2.

SUI/USDT Potential 90%++Accumulate under $1.08 - $0.9
Targets Points
TP 1 : $1.4
TP 2 : $1.5
TP 3 : $1.7
TP 4 : $1.9
TP 5 : $2.07
SL : $0.85

