SUI NEW VOLUME UPCOMINGSUI shows on a low time frame new upcoming volume, which can allow SUI to break soon.
SUIUSDT trade ideas

SUI analysis In this video I go through the recent bullish trend in SUI and anticipate where I think the retrace will take us for a possible long entry . I also highlight a possible short setup off of the Value area high if it comes in .
Tools used in the video TR Pocket / Fibs , Volume Profile and Pivots .
Appreciate your support any questions then please leave them in the comments
Have a great day

SUI – Multi-Timeframe Support TestCRYPTOCAP:SUI COINBASE:SUIUSD BINANCE:SUIUSDT
🟣 CRYPTOCAP:SUI is re-testing a major weekly channel support near $3.15. A strong defense here could trigger a solid bounce 🚀.
📊 Meanwhile, on the 4H timeframe, price is holding a crucial horizontal support.
👀 Stay alert — whether it breaks down or reverses, it could be a big move ahead!

SUIUSDT | Bullish Scenario Hello everyone.
Everything is clear in the video.
Summery
Order block zone: 3.3692-3.2294
SL: 3.2041
TP: 4.1961
I Share my ideas with you and the only thing you have to do is supporting.
Thanks.

Long SUISUI has formed an accumulation pattern based on the Wyckoff method. The Sign of Strength (SOS) phase appears to be complete, and SUI is now trending higher
Long setup is as in chart.
Disclaimer:
This analysis is based on my personnal views and is not a financial advice. Risk is under your control.

Current market updateWe’re seeing multiple setups across many altcoins — but one of the best right now is on SUI.
The major trend reversal zone and the bearish target region are overlapping, giving us a high-probability setup.
Those who position themselves well in altcoins now will be happy in the coming days and weeks :)

$SUI | 4h - 12hKey support held at swing low.
Looking for a strong move to $4.1 if bulls keep control.
Lose $3.42 — next support $3.22–3.33.
Break below $3.22 — bulls out, bear party starts.
Wait for confirmation, don’t rush.

#SUIUSDT: A Swing Buy In Making, Get Ready For Big MoveThis cryptocurrency pair is currently undergoing consolidation, and we’re observing a shift in price momentum. A substantial volume could enter the market at any moment. Two potential reversal zones exist where significant volume could emerge and potentially push the trading price above $8. We’ve also positioned two take profit targets in conjunction with these zones.
It’s important to remember that trading or investing in financial markets carries significant risks to your capital. We don’t guarantee that the price will move precisely as described.
Prioritise safe trading practices. If you’d like to show your support, you can like, comment, or share our ideas.
Team Setupsfx_

Short SUISui bounced off the resistance level after an ascending trendline was broken to the downside. The decline to support level at $3.09 is expected to happen

SUI/USDT spot (Buy Signal - Daily)📌 SUI/USDT (1D) Summary
Trend: Starting to turn bullish after a long downtrend
Buy Zone: Around 3.49 USDT
Targets (TP):
TP1: 3.68 USDT
TP2: 4.80 – 5.08 USDT
Stop Loss (SL): Below 3.05 USDT
Potential Profit: Up to +37%
Potential Loss: Around -12%
✅ Bullish Signs:
Price bounced from buy zone
Strong volume
⚠️ Risk:
Trend may fail if price breaks below 3.20

SUI/USDT is Nearing an Important Support!!Hey Traders, in today's trading session we are monitoring SUI/USDT for a buying opportunity around 3.2460 zone, SUI/USDT is trading in an uptrend and currently is in a correction phase in which it is approaching the trend at 3.2460 support and resistance area.
Trade safe, Joe.

#SUI/USDT#SUI
The price is moving within a descending channel on the 1-hour frame, adhering well to it, and is heading for a strong breakout and retest.
We are experiencing a rebound from the lower boundary of the descending channel, which is support at 3.40.
We are experiencing a downtrend on the RSI indicator, which is about to break and retest, supporting the upward trend.
We are looking for stability above the 100 Moving Average.
Entry price: 3.70
First target: 3.81
Second target: 3.91
Third target: 4.09

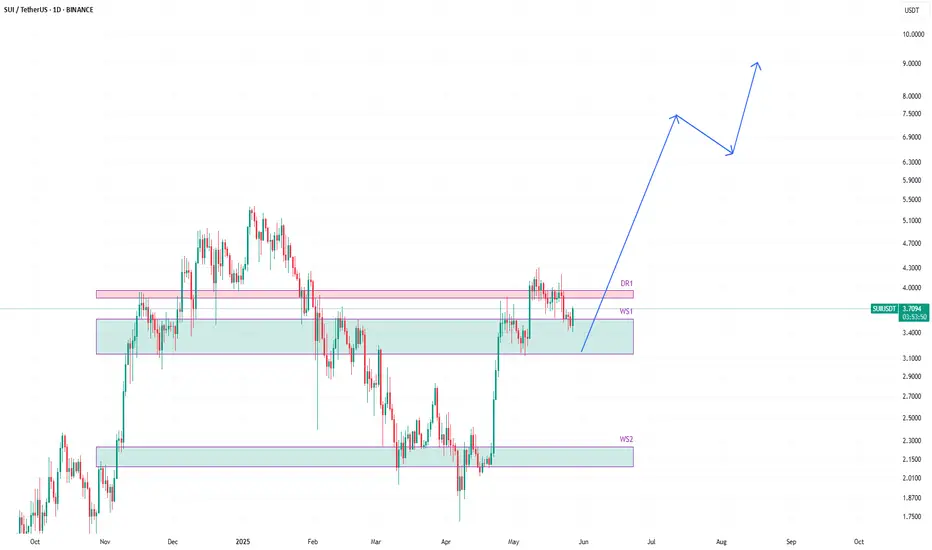
SUIUSDT likely to head higher towards 9$SUIUSDT is very bullish. I think this is just a pullback on this upward journey that it started at the begninning of april 2025.
The price is currently trading around weekly support WS1. It is possible that it might retrace further, but upward journey for this one in coming weeks in highly likely.
A good bounce from weekly support, we can already witness, and this could be the start of the journey already.
But as mentioned before, some further retracement before resuming upwards joeuney cannot be ruled out.
I am slowly adding this one as I am pretty confident that this one is going to do well in the coming weeks/months.
What do you think?
Weekly trading plan for SUIIn this idea I marked the important levels for this week and considered a few scenarios of price performance
Write a comment with your coins & hit the like button and I will make an analysis for you
The author's opinion may differ from yours,
Consider your risks.
Wish you successful trades ! mura

Failed Wedge, New Setup. Is SUI About to Break Out?In my previous post about BYBIT:SUIUSDT , I mentioned a potential falling wedge pattern. However, the breakout above the 4.0040 resistance turned out to be a false breakout, and the price eventually dropped to the invalidation level at 3.5868. This made the setup invalid.
But despite the failed wedge breakout, BYBIT:SUIUSDT remains in a bullish trend overall. During the current consolidation, the price appears to be forming a new bullish pattern — a Descending Broadening Wedge (DBW).
This pattern typically starts with low volatility and gradually widens. Once price reaches its lower boundary, it often experiences a strong breakout to the upside.
Let’s break down the key price action in this DBW setup:
Price is moving within a Descending Broadening Wedge and is currently near the lower boundary of the pattern.
It’s also sitting around a key support level at 3.4833.
A rejection candle formed right at 3.4833, showing the market’s response to this support area.
A reversal confirmation would come if the price breaks above 3.6102.
A bullish divergence is also visible — price is forming lower lows, while the stochastic indicator is forming higher lows.
Based on these five price action signals, it seems that buyers are still in control, even though short-term volatility has created a series of lower lows.
That’s why I still believe BINANCE:SUIUSDT has more room to go up. What’s your take on this?


SUI/USDT – Two Scenarios in Play: Impulse or Ending Diagonal?SUI is at a key decision point on the 4H chart. The current structure may either be:
a classic impulse wave, with wave (5) still incomplete, or
a bearish ending diagonal, suggesting the uptrend is losing strength.
If this is an impulse, price could continue toward the upper boundary of the wedge to complete wave (5).
However, if this is an ending diagonal, a sharp breakdown could target the support zone around $2.93, near wave (2).
📌 Stay cautious until a breakout or breakdown confirms the direction.
🕰️ Timeframe: 4H (Binance)
📉 Key support: $2.93

Coiling for a Breakout – Watch This LevelAfter a strong upward move, BYBIT:SUIUSDT is currently consolidating in a sideways range, forming what appears to be a falling wedge pattern — a classic bullish continuation setup.
If this pattern plays out, there's a good chance the price will resume its uptrend, supported by a bullish divergence forming within the wedge. The key level to watch is the resistance at 4.0040. A clean breakout above this level should be backed by strong momentum. However, if the price breaks above but quickly drops back below 4.0040, it could signal a lack of buying pressure — increasing the risk of a failed breakout.
This bullish scenario remains valid as long as the price holds above 3.5868. The next potential upside targets are 4.7996 and 5.0552.
Keep an eye out for a high-volume breakout and a strong candle close above 4.0040 to confirm the move.
What’s your take on BINANCE:SUIUSDT ?

SUI to longSui is moving in an upward channel.
One can long from
Entry: 3.8590
Tp 1 : 4.2775
Tp 2 : 4.6
Tp 3: 5.0645
Stoploss : 3.6990
DYOR

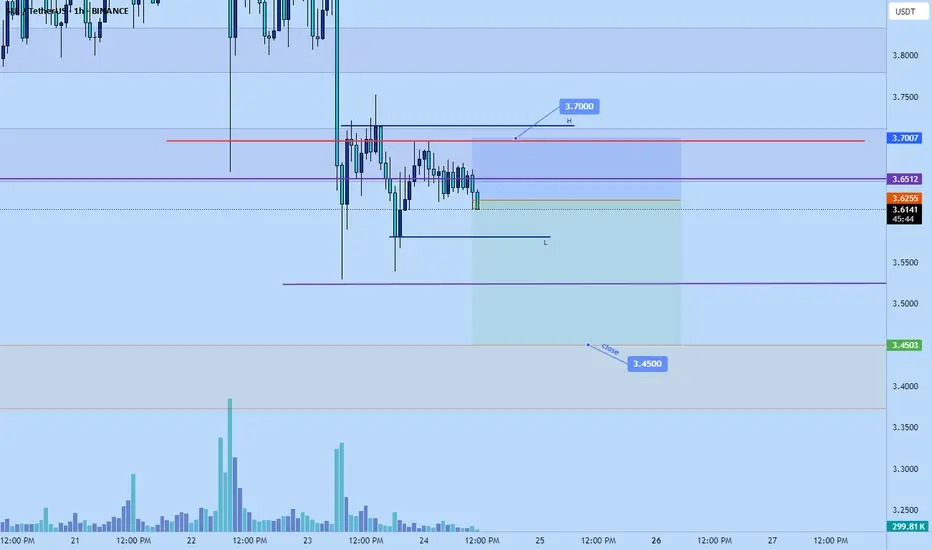
Sui short to $3.45Just now entered a short position on #sui
Targeting $3.45
stop: $3.7 or higher
Roughly 2RR- playing it conservatively.
before any big upside I expect market to fall back a bit lower.
SUI in Wyckoff AccumulationHere at the 30 minute time frame, SUI looks to be forming a Wyckoff Accumulation pattern.
It is possible to have one or two more secondary tests (ST) and then a strong move up beyond the level of the creek (Jump Across the Creek), and if that happens, it will be boom town again.
This will be invalidated if the price falls below $3.50.

SuiusdtHi snipers. On the one-day time frame, we are witnessing the formation of a flag pattern. The flag is a bullish pattern. The price is moving in an ascending channel. I am practicing and learning and this is not a buy or sell recommendation.

$SUI: update 24th May 2025 🚀 CRYPTOCAP:SUI – One of the Top Picks This Cycle
I'm closely following CRYPTOCAP:SUI , which I believe is one of the strongest altcoins of this cycle.
If you've been following me, you probably caught the entry in the green box, which once again turned out to be a perfect buy zone.
If not, and you're still on the sidelines, this update is for you.
⚠️ Warning Signs After the Pump
After the recent massive pump, we’re seeing clear bearish divergence on the RSI — a strong signal that a correction is incoming. The natural support level for this pullback is around $3.20.
And let’s be honest — the lower it dips, the better the entry.
But if $3.20 doesn’t hold, we could see a quick dump back to the green box, which would be an ideal re-entry point just in time for the next leg of the altseason, likely starting September 2025.
🔍 Indicators Breakdown
MACD (Daily): Overheated and needs to cool down
RSI: Bearish divergence is clearly forming and needs to play out
Vortex: Signaling upcoming bearish pressure
📈 What’s Next?
This is a monitoring phase. Watch for:
Support at $3.20
Stronger support at $2.20 (green box)
Target: $5+ in the medium term
This pullback could extend into August, so be ready to enter before September, when we expect the next explosive move.
📌 Follow me for updates and don’t forget to DYOR.
#SUI #Altcoins #CryptoUpdate #TechnicalAnalysis #Altseason2025 #MACD #RSI #CryptoEntry #SupportLevels #DYOR #BullishSetup #Cryptocurrency
