#SUI/USDT#SUI
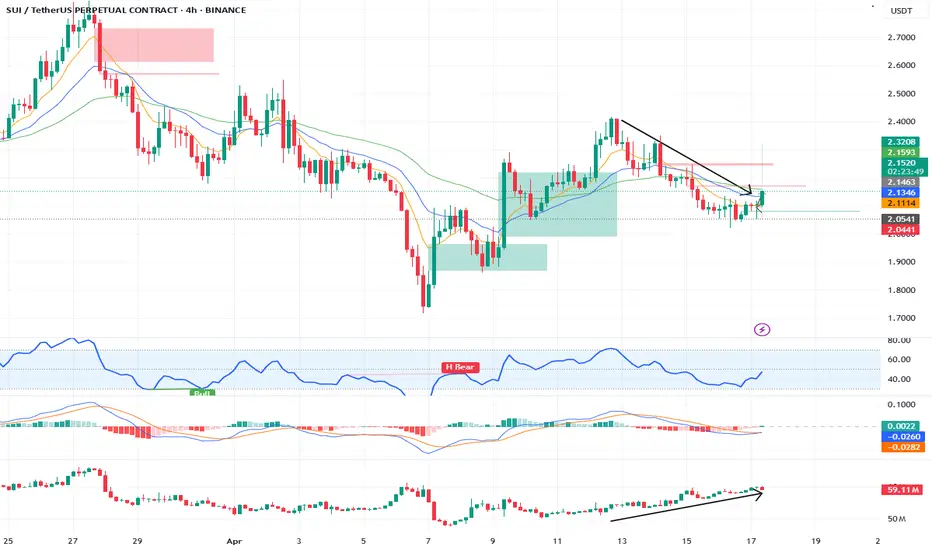
The price is moving within a descending channel on the 1-hour frame, adhering well to it, and is heading for a strong breakout and retest.
We are seeing a bounce from the lower boundary of the descending channel, which is support at 2.14.
We have a downtrend on the RSI indicator that is about to break and retest, supporting the upward trend.
We are looking for stability above the 100 moving average.
Entry price: 2.20
First target: 2.31
Second target: 2.39
Third target: 2.46
SUIUST trade ideas

Sui Buy IdeaHow do you know a good breakout?
According to Edward and Maggie in their classic charting book, a breakout should around 3% of the candle closing outside the pattern.
And if you can see Sui has broken out of it's 4 months trendline.
I see more bullish moves ahead.

SUI - HOLD / POTENTIAL LONGAnalyzing SUI/USDT on the 4H chart, I see a clear breakout from a descending wedge — a classic bullish reversal pattern. The price has broken through the resistance line with volume, suggesting early momentum shift.
This zone might be the beginning of a bigger move. I’m personally considering this coin for a mid-term hold, with potential to scale into a long if confirmation continues.

Lingrid | SUIUSDT key Support LEVELS Holding after RetestBINANCE:SUIUSDT market retraced to the support level before rebounding, having taken liquidity from below the psychological level of 2.00. This move was also accompanied by a fake breakout of the previous month's low, indicating a potential reversal in sentiment. On the daily timeframe, price is testing the November levels where we saw a surge. Looking left, we can see that the price has bounced off this support level twice before, highlighting it as an area of interest. I anticipate that the price will continue to rise from this area if sudden news doesn't drag it down. My goal is resistance zone around 2.40
Traders, if you liked this idea or if you have your own opinion about it, write in the comments. I will be glad 👩💻

SUI Breaks Key Trendline – Bullish Reversal in MotionCRYPTOCAP:SUI has broken above the descending resistance line, confirming a trend reversal after weeks of downward movement. This breakout came after price bounced from a strong support zone, establishing a higher low structure.
The breakout is also supported by a move above the 50 EMA, adding strength to the bullish case.
DYOR, NFA

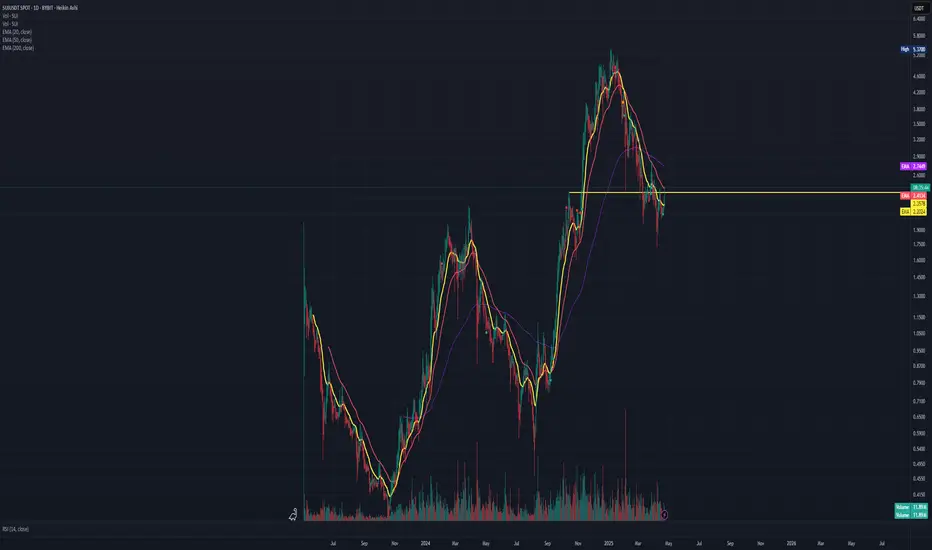
SUI SUIUSDT - Moving above 20d EMA with volume $SUIMoving above the yellow EMA with strong volume now.
Resistance - Around 2.75–3.00 (EMA resistance).
Support - Around 2.40 (EMA), then lower at 1.80 or even closer to 0.64 if it breaks down further.
High - 5.37 – serves as a long-term resistance if price trends back upward.
$SUI - Scalp Long TradeSUI | 4h
Price is holding $2.30 — I'm starting to scale into longs at current levels.
Looking to add more if it dips into the $2.30–$2.27 range.
Stoploss is set just below $2.20 (vwap).
Targets:
$2.40
$2.50
$2.60

Sui Long possibility Market seens to reverting to uptrend in big charts like W and Month , MACD and RSI in good set up

SUI looking good for a relief rally towards 4$- has been down only ever since the top with no real bounces inbetween
- with btc likely heading to at least to 92k from here but possibly even new ATHs, SUI should obviously follow
- potential falling wedge in place, not the most perfect one but good enough to consider it an option

SUI Long-Term H&S: Epic Crash Ahead?
SUI daily chart paints a clean Head and Shoulders pattern, pointing to a massive drop to around $0.83 by late Summer. As a fractal, this model also aligns with the trough-to-trough cycle from October 2023 to August 2024.
What do we think?

Can't BEAR it — SUI breakdownSUI has broken the channel it was in, and looks to be in a bearish trend until it scoops up more liquidity around the $4.00 mark — with possiblilies of hitting even lower depending on market sentiment at the time of the next dip.
NFA.
Please hit the rocket if you like this post.

SUIUSDT | Buyers Are Active but Patience Pays MoreWe're seeing some interest from buyers on SUIUSDT at the current levels, but personally, I wouldn’t rush into a serious position just yet. This kind of price action, especially in this part of the chart, can often be deceptive and cause unnecessary emotional trading.
📌 Wait for the Blue Box
The blue box below represents a much stronger area of interest, where I believe more reliable demand could show up. Entering at these levels without proper confirmation or structure could expose you to unnecessary risk.
🎯 Let the Market Come to You
Instead of trying to guess every move, the better strategy is to let the market present the trade to you at a level that has historically shown strength. That’s where you get the best entries, with minimized risk and higher reward.
💬 Follow the Smart Side of Trading
Every level I share is built on deep observation, backed by consistency and clarity. If you're following me, you're not just copying boxes, you're following a structured mindset and a refined strategy that keeps delivering results when others are guessing. Stay sharp and keep your edge.
📌I keep my charts clean and simple because I believe clarity leads to better decisions.
📌My approach is built on years of experience and a solid track record. I don’t claim to know it all but I’m confident in my ability to spot high-probability setups.
📌If you would like to learn how to use the heatmap, cumulative volume delta and volume footprint techniques that I use below to determine very accurate demand regions, you can send me a private message. I help anyone who wants it completely free of charge.
🔑I have a long list of my proven technique below:
🎯 ZENUSDT.P: Patience & Profitability | %230 Reaction from the Sniper Entry
🐶 DOGEUSDT.P: Next Move
🎨 RENDERUSDT.P: Opportunity of the Month
💎 ETHUSDT.P: Where to Retrace
🟢 BNBUSDT.P: Potential Surge
📊 BTC Dominance: Reaction Zone
🌊 WAVESUSDT.P: Demand Zone Potential
🟣 UNIUSDT.P: Long-Term Trade
🔵 XRPUSDT.P: Entry Zones
🔗 LINKUSDT.P: Follow The River
📈 BTCUSDT.P: Two Key Demand Zones
🟩 POLUSDT: Bullish Momentum
🌟 PENDLEUSDT.P: Where Opportunity Meets Precision
🔥 BTCUSDT.P: Liquidation of Highly Leveraged Longs
🌊 SOLUSDT.P: SOL's Dip - Your Opportunity
🐸 1000PEPEUSDT.P: Prime Bounce Zone Unlocked
🚀 ETHUSDT.P: Set to Explode - Don't Miss This Game Changer
🤖 IQUSDT: Smart Plan
⚡️ PONDUSDT: A Trade Not Taken Is Better Than a Losing One
💼 STMXUSDT: 2 Buying Areas
🐢 TURBOUSDT: Buy Zones and Buyer Presence
🌍 ICPUSDT.P: Massive Upside Potential | Check the Trade Update For Seeing Results
🟠 IDEXUSDT: Spot Buy Area | %26 Profit if You Trade with MSB
📌 USUALUSDT: Buyers Are Active + %70 Profit in Total
🌟 FORTHUSDT: Sniper Entry +%26 Reaction
🐳 QKCUSDT: Sniper Entry +%57 Reaction
📊 BTC.D: Retest of Key Area Highly Likely
📊 XNOUSDT %80 Reaction with a Simple Blue Box!
📊 BELUSDT Amazing %120 Reaction!
I stopped adding to the list because it's kinda tiring to add 5-10 charts in every move but you can check my profile and see that it goes on..

**SUI Poised at Crucial Support: Will a Breakout Follow?**SUI is currently perched on a critical support area on the higher timeframes, and all signs point to an impending decisive move. This zone is supported by multiple high-confluence indicators—including the VWAP’s point of control, daily support, and weekly support—making it a high-probability region for a potential reversal or continuation setup.
Over the past several sessions, SUI has shown a gradual loss in bearish momentum. While the price structure has continued forming lower highs and lower lows, the pace of decline is clearly diminishing. At the same time, trading volume has been steadily contracting, a classic signal of market compression. This tightening range is often a precursor to expansion, where the market breaks decisively in one direction.
At this point, the market appears to be in a state of balance between buyers and sellers. The reaction to this support zone will likely determine the next significant leg for SUI.
- **High Confluence Support:** The alignment of VWAP POC, daily, and weekly support levels creates a strong foundation that buyers have consistently respected.
- **Loss of Downward Momentum:** Slowing price action and falling volume suggest potential accumulation or preparation for a move.
- **Breakout Confirmation Required:** A confirmed breakout above the local range high, supported by rising volume, is essential to validate a bullish reversal. Until then, the risk of further downside remains.
If bulls manage to defend this zone once more and reclaim the local range high with conviction, SUI could form a textbook high timeframe double bottom—potentially setting the stage for a significant reversal. Traders should closely watch how price behaves at these levels, as the outcome will likely shape SUI’s next directional phase.

#SUIUSDT Bull Flag Pattern Identified on the 4H Time Frame
➡️ **Entry:** 2.04 (Current Market Price)
➡️ **Targets:** 2.4020, 2.95, 3.49 (50% movement in spot)
➡️ **Stop Loss:** 1.60
As always, prioritize risk management to safeguard your investments and enhance your trading success! 💼📊

Sui My idea long to 2.48ish. I believe people will start shorting very prematurely leading to a short squeeze. When people are flipping bias. We will see a correction

SUI AND GENERAL MARKETA lot of bearish ideas floating around. I think people will get caught shorting prematurely and get squeezed. Then we will see a correction

SUIUSDT – Liquidity Build-Up or Just a Beautiful Trap?“If you’re long here, you’re not early. You’re just lunch.”
🧠 Institutional Context
Strong POC at $2.06
Price consolidating above the value area, with multiple rejections at $2.18–2.22
Open Interest rising while price stalls → leveraged longs stacking = trap in progress
Delta staying negative → buyers getting absorbed, not rewarded
Volume declining = no real demand, just retail chasing momentum
🔬 Order Flow Breakdown
Delta (15min & 4H) shows clear lack of follow-through on buy pressure
OI added +600K recently with no breakout = clear liquidity build-up
Heatmap reveals liquidation clusters below $2.04, with vacuum down to $1.88
BTC sitting on a cliff — a flush there takes everything with it
🎯 Trading Plan
Direction: Short
Entry: $2.18 – $2.22
Target 1: $2.04
Target 2: $1.88
Stop Loss: $2.33
Leverage: 25x – 50x
Trigger conditions:
– BTC drops below $84K
– SUI fails to break $2.22 on rising OI and negative Delta
– Volume remains dry
🧨 Final Thoughts from Pôncio
“This isn’t strength. It’s a funeral procession with confetti.”
Everyone’s bullish.
Everyone’s positioned.
Everyone’s about to get slapped.
Summary:
Smart money is already out.
Retail’s stuck buying into resistance.
And when this drops, it won’t bounce — it’ll vanish.
📉 #SUIUSDT #CryptoFutures #OrderFlow #SmartMoney #DeltaMatters
📛 Trade like a sociopath. Or fund someone who does.

SUI ShortOn the graph there are two scenarios I thought about when looking at SUI, it could sweep the closest sellside and then continue in the downtrend or potentially takeout further SSL above the closest one and the fallback lower. We will see
Using 10x lev on both trades if they get filled

SUI - Bearish Retest Before Possible Reversal?SUI is currently in a downward trend, trading below the 30-period SMA, indicating bearish momentum. Price recently broke below a key support zone and is heading toward a broader ascending trendline.

Phemex Analysis #74: Pro Tips to Trade SUISUI ( PHEMEX:SUIUSDT.P ) is experiencing a challenging start to 2025, with its price declining 68% from its all-time high of $5.37 on January 6th. However, a potential bullish reversal signal is emerging, as the recent drop to $1.71 coincides with a Relative Strength Index (RSI) divergence, where the price makes lower lows while the RSI makes higher lows. This divergence suggests that the downward momentum may be weakening, and a trend reversal could be imminent. Let's explore the possible scenarios for SUI to guide our trades.
Possible Scenarios
Based on the current technical setup, here are several potential scenarios for SUI's price action:
1. Bullish Reversal and Breakout
The RSI divergence suggests a potential bullish reversal. If SUI breaks above key resistance levels with strong volume, it could confirm this reversal and lead to a significant upward move.
Pro Tips:
Monitor key resistance levels, such as $2.42 and $2.83.
A break above the $2.42 resistance level (or $2.83 for further confirmation), accompanied by increasing volume, would be a key signal.
Consider entering a long position on the breakout, with a stop-loss order placed below the breakout point or a recent swing low.
Potential profit targets for short-term profits are $3.56 and $4.25.
2. Consolidation and Range Trading
SUI's price may consolidate within a range as the market digests the recent decline and the potential for a reversal. This consolidation period could offer range-bound trading opportunities.
Pro Tips:
Identify support and resistance levels that define this range, such as the $1.71 support and $2.83 resistance.
Within this range, consider buying near the $1.71 support and selling near the $2.83 resistance.
It's important to set stop-loss orders outside the range to manage the risk of a potential breakout or breakdown.
3. Failed Reversal and Further Decline
While the RSI divergence is a bullish signal, there's a risk that the reversal fails, and the price continues to decline. This could happen if broader market sentiment turns bearish or if new negative information about SUI emerges.
Pro Tips:
Monitor key support levels, such as $2.0 and $1.71. A break below these levels with high volume could signal further decline.
If the price fails to break above $2.83 and starts to decline with strong volume, consider exiting long positions.
In a bearish scenario, shorting opportunities may arise on a break below significant support, but this should be done with caution and a tight stop-loss.
Conclusion
SUI presents a complex trading situation. The RSI divergence offers a potential bullish reversal, but the preceding sharp decline and overall market conditions create uncertainty. Traders should carefully monitor price action, volume, and key support and resistance levels. By considering the scenarios outlined above and employing sound risk management practices, traders can position themselves to potentially profit from SUI's price movements, whether it reverses upward, consolidates, or declines further.
Pro Tips:
Elevate Your Trading Game with Phemex. Experience unparalleled flexibility with features like multiple watchlists, basket orders, and real-time adjustments to strategy orders. Our USDT-based scaled orders give you precise control over your risk, while iceberg orders provide stealthy execution.
Disclaimer: This is NOT financial or investment advice. Please conduct your own research (DYOR). Phemex is not responsible, directly or indirectly, for any damage or loss incurred or claimed to be caused by or in association with the use of or reliance on any content, goods, or services mentioned in this article.

Long setup on SUISetting up long for SUI.
Using 4H time frame.
You can see OI increasing and Price decreasing which is divergence.
Sui short back to $2.00Just opened a short position on Sui.
Anticipating a potential break down back to $2.00 but I'll likely take profit along the way.
Still monitoring entry.

$SUI | 2D Technical Setup longPrice is approaching key support zones that previously triggered impulsive rallies. Oscillators are flashing a potential bullish divergence, and the $2.00 level stands out as a short-term demand zone.
📌 Scenarios:
— Scalp Long Setup: Reaction off $2.00 with a tight stop below the recent low. Suitable only for short-term trades or scalps.
— Swing Buy Zone: Sits deeper at $1.40–$1.60, aligning with weekly and daily demand. Spot bids already placed in that range.
⚠️ Structure Reminder: Price remains bearish unless we reclaim $2.50+ on a closing basis. Until then, this is bottom formation in progress — not yet confirmed reversal.
🎯 Plan:
— Watch for SFP or bullish structure around $2.00
— Scale heavier at $1.50–$1.40 zone
— Invalidation below $1.08
— Initial target: reclaiming $2.58
