Sui Works To Break Resistance · Play To Win · No StressA flat bottom is bullish because support can be confirmed as found when sellers (bears) fail to move prices past a certain point. A flat bottom produces the double-bottom and triple-bottom reversal signals. When the bottom is flat, depending on the phase the market is going through, we can easily say bullish. A flat top is not bearish, it is a completely different story.
A flat top does not confirm resistance being found and thus a new bearish wave. We need context, it all depends on the phase of the market cycle. A flat top with a rising bottom is bullish. Resistance has been found and is being challenged. It is getting weaker because the action is converging towards the resistance point based on the rising bottom.
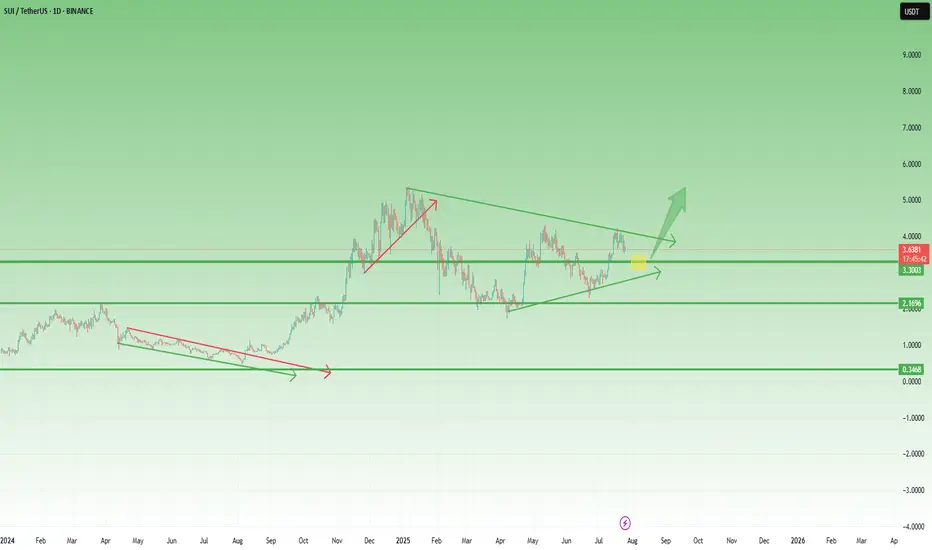
Here we have a flat top with a rising bottom (higher lows). The market is bullish. SUIUSDT has been bullish and growing since late 2024. This is the content we need. A bullish tendency, a rising market and resistance being challenged more than once starts to reveal a picture. Next this resistance won't have enough strength to hold. Next time SUI moves up it will continue rising to produce a new all-time high and this will unleash a price discovery phase.
SUIUSDT is trading above EMA55 and EMA89. The last challenge of resistance produced a rejection but this rejection did not lead to a test of the above mentioned support. Another signal of strength.
Sellers cannot push prices lower because buyers are active, or simply put, there are not enough sellers to start and thus the retraces become smaller and shorter. Price dynamics favoring the bulls.
The lows are getting higher, the top remains the same. When the low meets the top that is when resistance breaks. Sui is going up, it will continue to grow; the targets on the chart can be hit short-term.
There is no sense of urgency, but a major advance can be happening within days.
Are you ready to trade and hold? Prices going up aiming high trading requires no effort.
The effort is mental, the mind can be trained to succeed and avoid stress. Mental stress = lack of knowledge. If you know prices are going up and you feel certain about it, no effort is required to win because the mind doesn't have to struggle with questions relating to the strength of your position. The mind does not need to answer, should I buy or should I hold? Since you know prices are going up based on the chart, you can sit back and relax watching your profits grow. Reading relaxes the mind. Knowledge is food for the soul. The more you learn, the more you know the wiser you become. Wise means effortless. Trading can be effortless if you read the right stuff. Play to win. Plan before trading and you already won.
Answer the question before the situation shows up. That's it, you've just removed the complexity out of the game. When there is no complexity, there is no mental stress. Since you are sitting on a chair in front of a device, trading becomes effortless. To trade with peace in your mind you just need the right knowledge and that is what you are getting here. No stress.
Continue reading and watch your profits grow. Increase your peace, free up your time and enjoy better results.
Namaste.
SUIUST trade ideas
SUI | Spot Buy Zone for PullbackPrice has pulled back after a local top and is heading toward a clear demand zone.
Key buy area sits around $3.12, aligned with 0.618 retracement and recent consolidation.
Strong structure below—if majors keep retracing, this is where risk/reward for new spot buys becomes attractive.
Plan:
Waiting for price to reach the green zone to accumulate spot.
Invalidation below $2.80, targeting a move back toward $4.45 and higher if momentum returns.

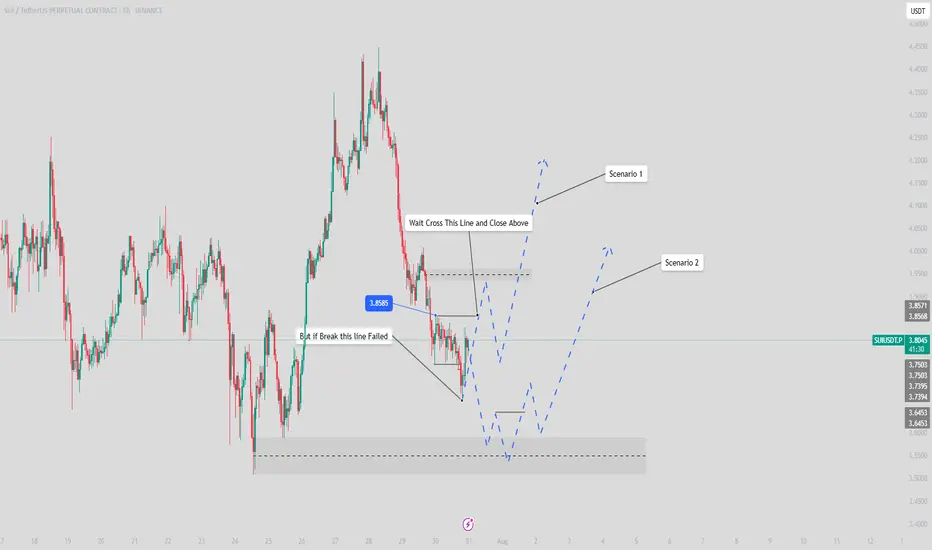
SUI Price Idea
Be Carefull and Full Patient on SUI today because if the price break and closing under Choch Line the probability to go down is possible, but if break the line without closing below the line we can wait for the choch on the low Time Frame for buy opportunity
#staysafu

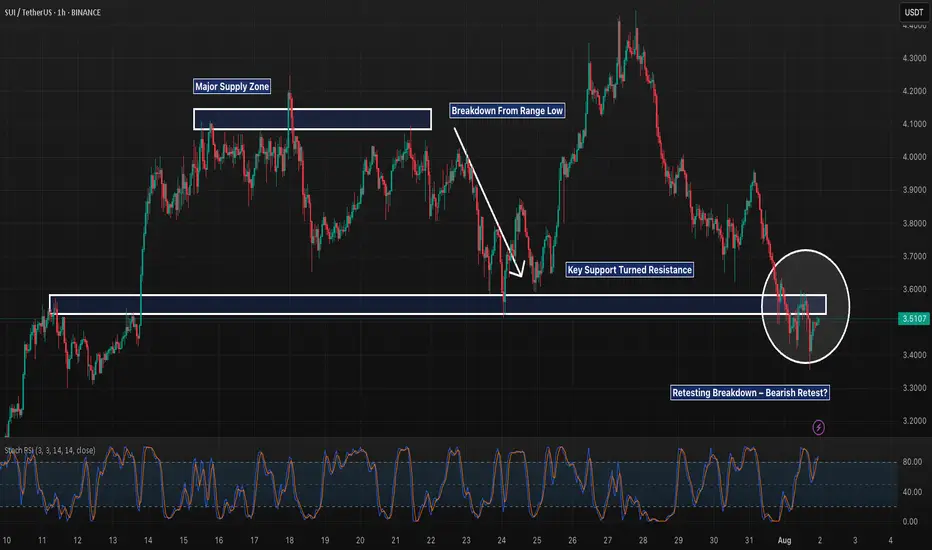
SUI 1H – Breakdown & Retest of Key Support, But Will It Reject?SUI 1H – Breakdown & Retest of Key Support, But Will It Reject or Reclaim?
Description:
SUI just completed a textbook range breakdown after weeks of sideways chop between ~$3.60–$4.10. The prior support floor has now flipped into resistance, and the recent bounce appears to be retesting that structure. If this retest gets rejected, continuation toward lower support zones (potentially $3.30 and below) becomes likely.
However, reclaiming and holding above $3.60 could trap late shorts and fuel a squeeze. Structure still favors bears for now, but it’s decision time.
📌 Breakdown structure
📌 Bearish retest
📌 Eyes on confirmation or invalidation
This is the battle zone — stay sharp.

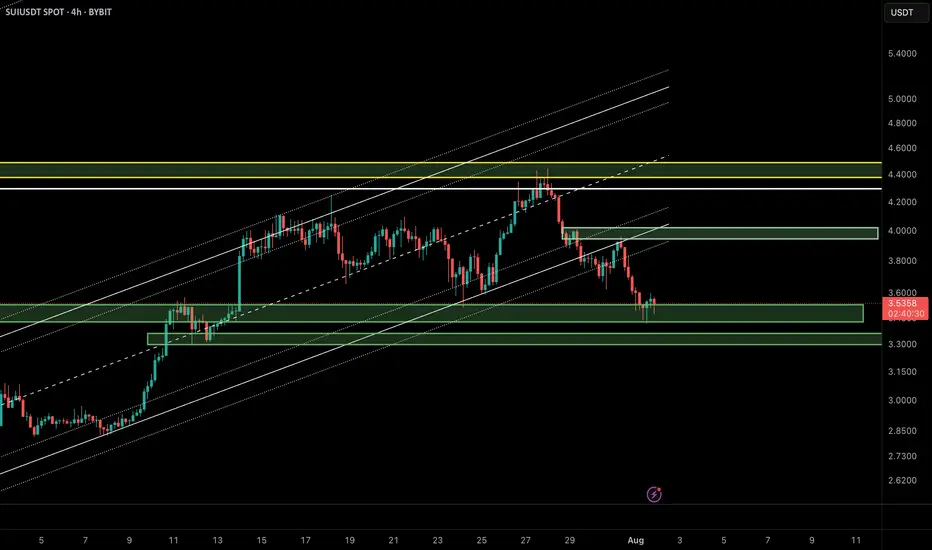
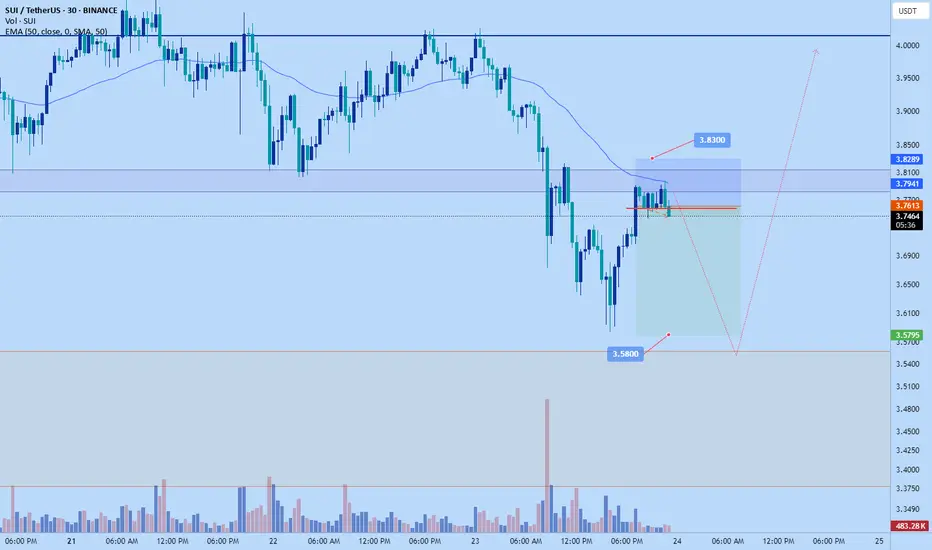
SUI/USDT Update – Bounce Setup from Demand Zone?In the previous analysis, we highlighted a short opportunity near $4.20, which played out perfectly. Now, SUI has reached a key demand zone around $3.40–$3.55, overlapping with the lower boundary of the ascending channel and a previously defined bullish order block.
🔹 Market Structure:
After breaking the bullish structure, price is now revisiting a major liquidity zone between $3.40 and $3.55.
🔹 Price Behavior:
Wicks to the downside suggest buy-side absorption and potential for short-term reversal.
🔹 Possible Scenario:
If the $3.40 zone holds, we could see a corrective move up to the supply zone around $3.90–$4.00.
📌 Key Levels:
• Support: $3.40–$3.55
• Resistance: $3.90–$4.00
❗️If the $3.40 support fails, bullish momentum will likely be invalidated in the short term.
🧠 Pro Tip (SMC-based):
When a demand zone aligns with liquidity sweep and channel support, it often becomes a high-probability area for institutional re-entries. Wait for a clear confirmation like BOS or bullish engulfing candle before entering.
⸻
🔗 Like, share, and follow for more Smart Money & Elliott Wave-based insights!
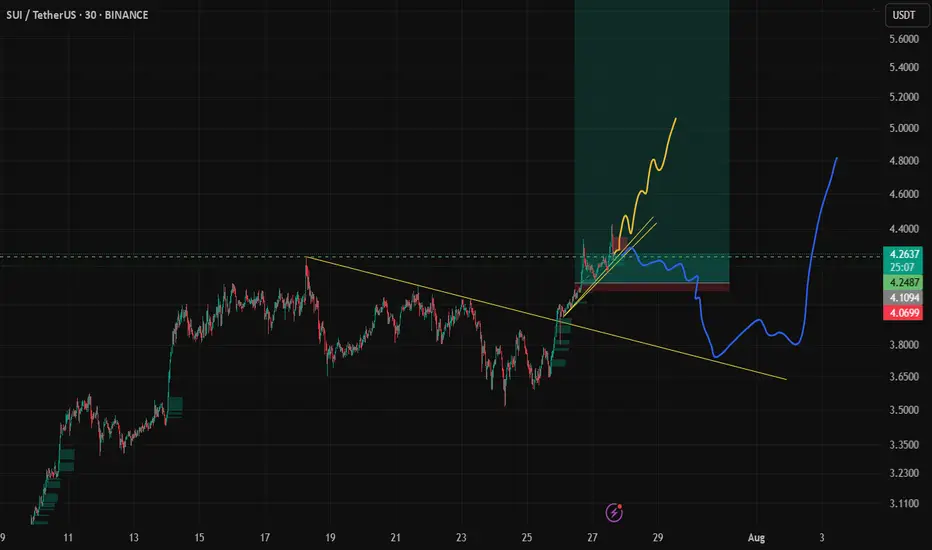
#SUI Update #2 – July 31, 2025#SUI Update #2 – July 31, 2025
SUI has completed the correction of its last impulsive move and has started another upward movement. Although it currently appears to be a weak move, I believe it will provide around a 10% profit. As shown in the chart, I have opened a long position.

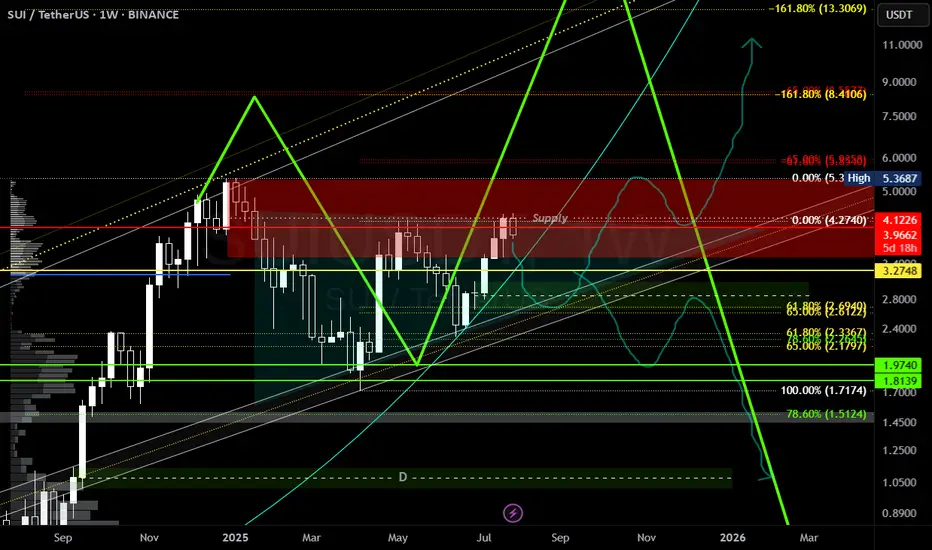
#SUI HTF Update Major update on #SUI after 6 months or so...
We have been tracking this idea since 2024, i am still biased with entire market & not looking at 2026 for ONE MORE run up, we just have few months left now & with august coming up i believe we will see one final dip before blasting everything in September. Majors topping around September & other alts like sui probably in October.
I have already updated about my positions before do check if you haven't yet.
SUI RETESTING THIRD IMPULSE HIGH - 2 SCENARIOSSUI could come back down to retest the trendline break. It has just retested the third impulse high. Set up is still valid. Respecting the trendline(s) for the time being. 2 scenarios could play out - higher or lower...hahaha.
SUI Breaks Out on Hype Surge — Momentum Cooling After Sharp PumpSUIUSDT 1H chart showing a clean breakout following renewed hype around SUI’s DeFi/NFT expansion. Over the past 48 hours, SUI gained ~15% as social buzz and bullish sentiment picked up — driven by strong ecosystem growth and analysts labeling it “ready for a second wave.”
Price broke above recent consolidation around the $3.95–$4.10 zone and surged to new local highs near $4.40. However, the first test of that high was immediately rejected, with the current candle showing signs of a minor cooldown. Stochastic RSI confirms this — hinting at potential for a short retracement or consolidation before continuation.
Key levels to watch:
$4.10–$4.00 zone (potential retest support)
$4.40 high as breakout resistance
Stoch RSI reset for a second leg
If buyers step in quickly on a retest, this breakout could extend into new territory. If not, we may see a revisit to the $4 zone before any further upside.

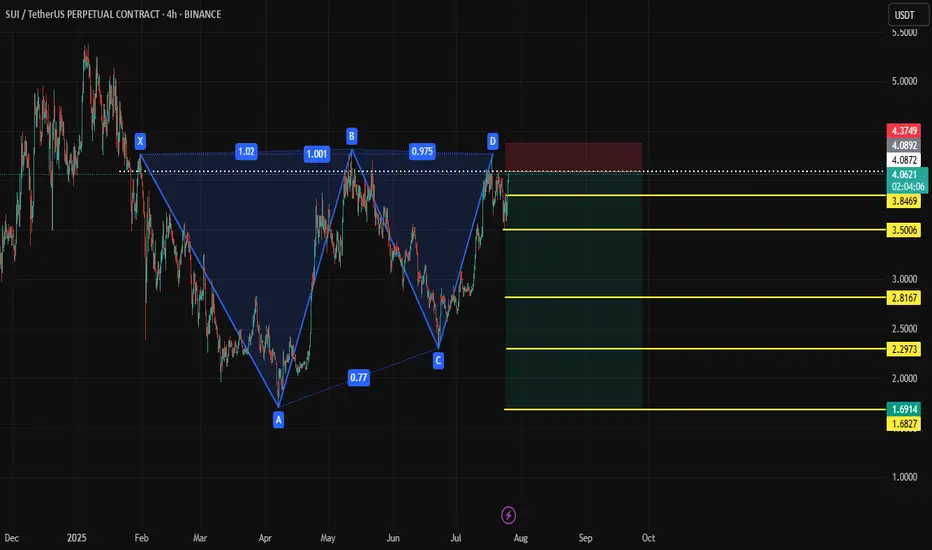
SUI Shortanalysis for sui bearish pattern
Short Entry: $4.10 – $4.20
Stop-Loss: $4.35+
Target 1: $3.60
Target 2: $3.10
Target 3 (Full XA move): ~$1.75 (aggressive)
SUI 99 RR COULD IT BE???SUI 99 RR COULD IT BE??? - massive multiplier. Relative strength. Big time frame HVF. SUI Could be ready to pop.
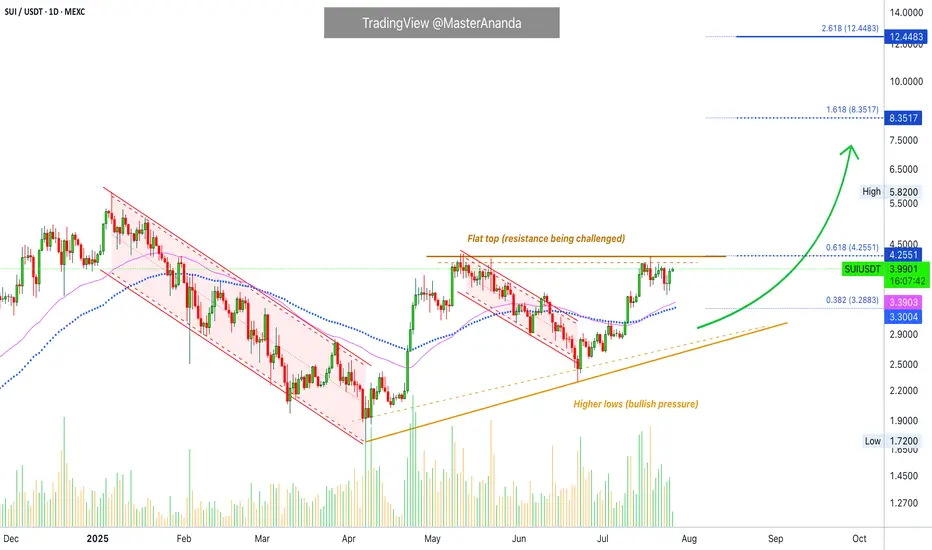
SUI/USDT Massive Cup and Handle Pattern Unfolding Is a Breakout?🧠 Technical Overview:
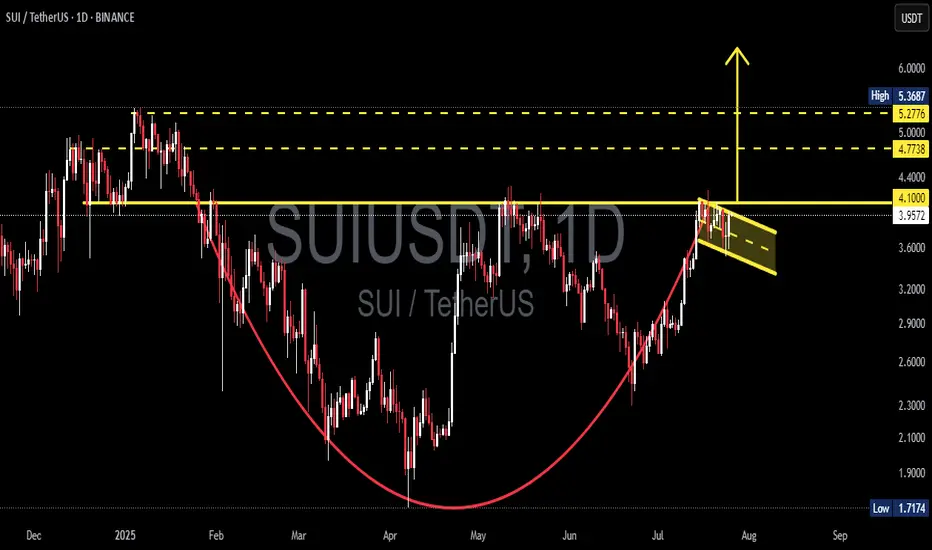
The daily chart of SUI/USDT showcases a textbook formation of the Cup and Handle pattern — a powerful bullish continuation signal that often precedes explosive upside moves.
The “Cup” took shape between January and July 2025, reflecting a deep rounding bottom. This indicates a long-term accumulation phase where bears gradually lose control.
The “Handle” is currently forming as a downward-sloping consolidation channel, often known as a bullish flag, which is typically the final pause before a breakout.
🔍 Key Technical Levels:
Current Price: $3.9661
Support Zone: $3.96
Major Resistance Levels to Watch:
$4.10 (handle resistance & breakout trigger)
$4.40 (local structural high)
$4.77 (previous high & fib extension zone)
$5.00 (psychological level)
$5.36 (measured move target from cup breakout)
---
🟢 Bullish Scenario: Breakout Incoming
If price breaks and closes above the handle resistance around $4.10, backed by increasing volume:
This confirms the Cup and Handle breakout.
Expect a rapid move toward $4.77 – $5.36 in the short to mid term.
The height of the cup projected upward gives a target of approximately +35% gain from breakout point.
🔔 Watch for:
Bullish engulfing candles
Volume spike during breakout
Break of upper trendline from the handle
---
🔴 Bearish Scenario: Breakdown Risk
If the price fails to hold the $3.96 support and breaks down from the handle channel:
Price may retest lower support zones near $3.60 or even $3.20
However, as long as the cup’s base at ~$2.50 holds, the macro bullish structure remains valid.
⚠️ Invalidation: A daily close below $3.60 would invalidate the short-term bullish setup.
---
📊 Pattern Psychology:
The Cup and Handle pattern reflects investor accumulation, shakeout, and renewed confidence. This is often seen in strong uptrending markets — and the current structure suggests that bulls are quietly preparing for a potential breakout.
---
📅 Timing Outlook:
Handle formations typically last between 1–3 weeks. If this timeline holds, a breakout could occur before mid-August 2025.
---
✅ Conclusion:
The technical setup for SUI/USDT is extremely compelling. With a strong Cup and Handle pattern nearing completion, and key resistance just overhead, traders should prepare for potential breakout conditions. A confirmed move above $4.10 could trigger a bullish wave toward $5.00+.
📌 Set alerts. Manage risk. And don’t ignore the volume.
#SUI #SUIUSDT #CryptoBreakout #CupAndHandle #BullishSetup #CryptoChartPatterns #AltcoinAnalysis #TechnicalAnalysis #BreakoutTrade
TradeCityPro | SUI Eyes Breakout with Bullish Momentum Rising👋 Welcome to TradeCity Pro!
In this analysis, I want to review the SUI coin for you. It’s one of the Layer1 projects in the crypto space, currently ranked 13 on CoinMarketCap with a market cap of $13.66 billion.
📅 Daily Timeframe
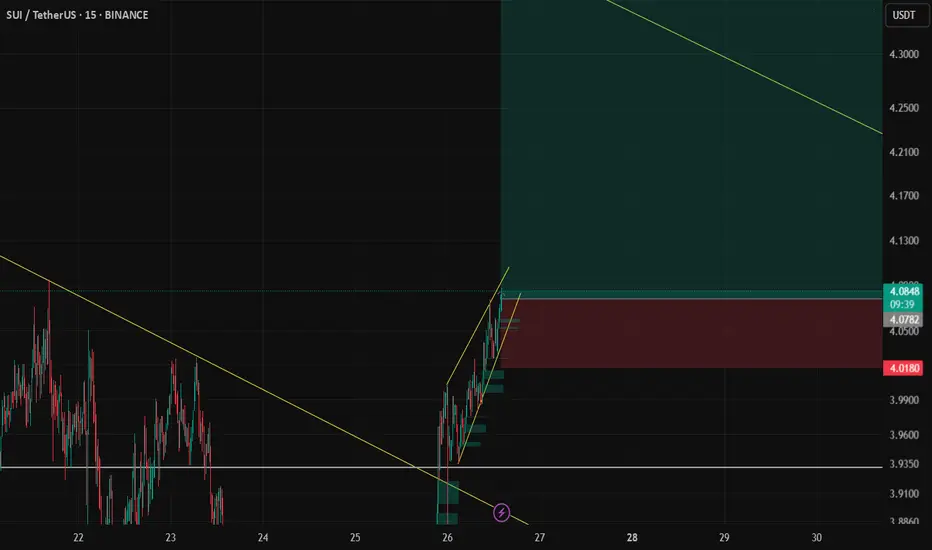
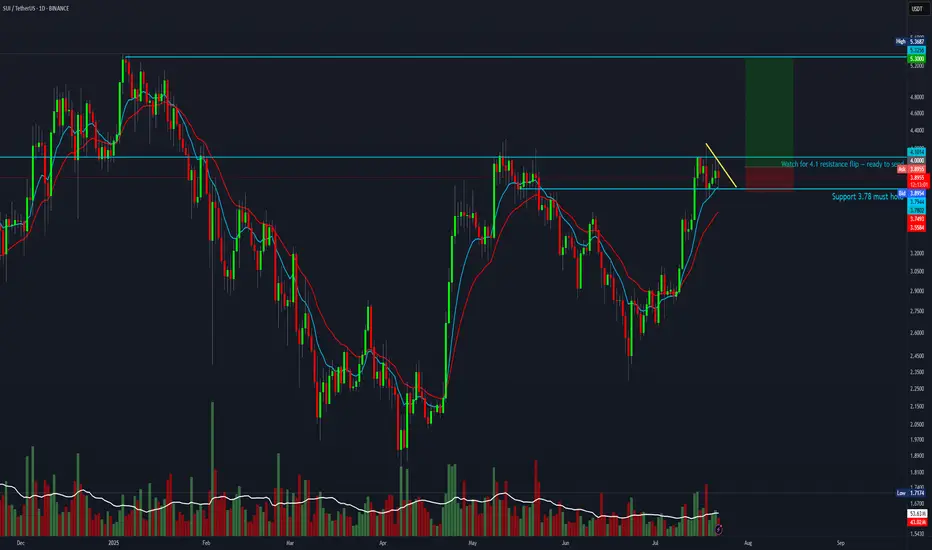
On the daily timeframe, a lot has changed for SUI since the previous analysis. After breaking the descending trendline, it has started a new bullish trend.
✔️ In the first bullish leg after breaking the trendline, the price reached the 4.0866 zone, and now after a correction, it’s moving upward again.
📈 The 4.0866 level is a very important resistance. In fact, we can draw a resistance range between 3.6402 and 4.0866, as the price tends to behave erratically within this zone.
⭐ Currently, the price has re-entered this range and if 4.0866 is broken, the bullish wave could continue. The first target for this wave could be 5.2689.
🔼 So, if 4.0866 is broken, I highly recommend opening a long position, because if the price truly breaks this level (and it’s not a fake breakout), then the minimum target would be 5.2689.
📊 If the buying volume continues to increase as it is now, and the RSI breaks above 76.64, the chances of breaking 5.2689 will also rise, and the price may even set a new ATH.
👀 I already have an open position on this coin based on lower timeframe triggers, and I’m currently waiting to see the reaction to 4.0866. Based on my entry, if the price moves toward 5.2689, the risk-to-reward ratio will be very high. That’s why I’ve kept part of my position open to potentially capture that move.
🛒 For spot buying, we can also use a futures strategy — meaning if 4.0866 breaks, we open a futures position targeting 5.2689, and then use the profit from that position to buy SUI in spot, gradually building our spot portfolio.
✨ If you are looking at this coin only for spot, the main trigger is the breakout of 5.2689. But be careful — if the price moves aggressively, it might not give you a proper entry trigger, and entering from that area might be difficult.
📝 Final Thoughts
This analysis reflects our opinions and is not financial advice.
Share your thoughts in the comments, and don’t forget to share this analysis with your friends! ❤️

SUI Trendline Broken
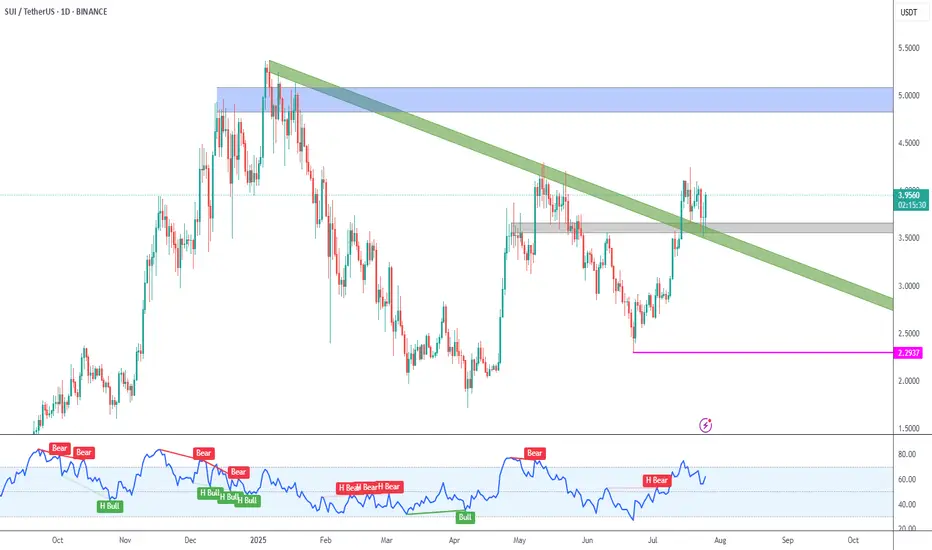
➡️ SUI has broken the green descending trendline originated on the early 2025 high.
➡️ Price is also being held by the gray support zone around 3.60.
➡️ Next target is the blue supply zone at 5.00 round number.
➡️ Invalidation is at 2.2937 (pink line), so be wary of liquidity hunts below gray support.
SUI – Base Formation for Next Leg HigherTrend Shift:
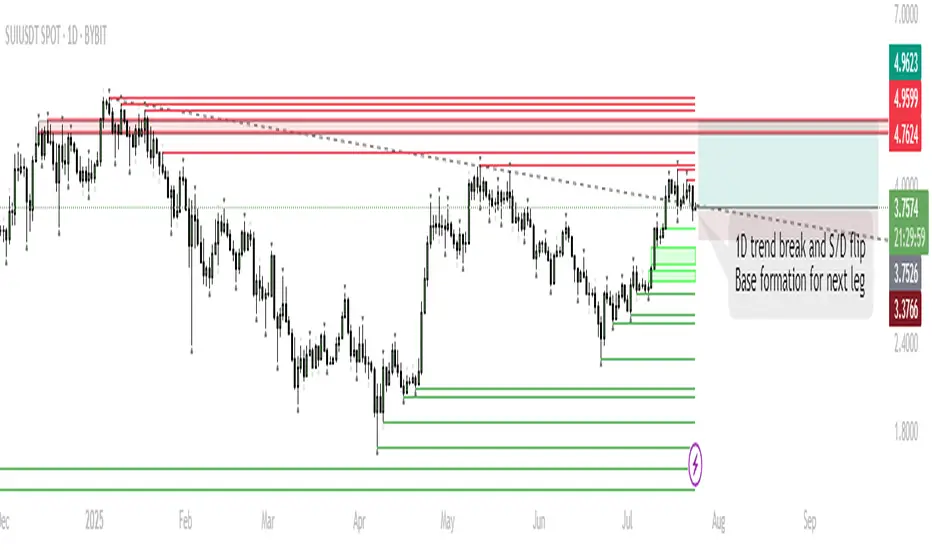
SUI has broken the 1D downtrend and is now consolidating above a key supply/demand zone, suggesting accumulation.
Short-Term Range:
Expect ranging/chop as price tests acceptance above broken resistance. This phase could last up to a week.
Trigger for Next Move:
Sustained closes above $4.0 will signal buyers are in control, opening the way for a move higher.
Targets:
If the base holds and SUI establishes above resistance, the next push is toward $5.10–$5.40 (previous highs/ATH zone).
Invalidation:
A sustained move below $3.37 would invalidate the bullish base thesis and open the door for deeper retrace.
SUI has flipped its 1D trend and is now consolidating above a key S/D level. Historically, such consolidations above reclaimed resistance often precede strong trend continuation. While a short-term range is likely as the market digests recent gains, the structure favors an eventual push toward previous highs and potentially new ATHs in August. Patience during this ranging phase is key; the setup remains bullish unless price falls back below $3.37.
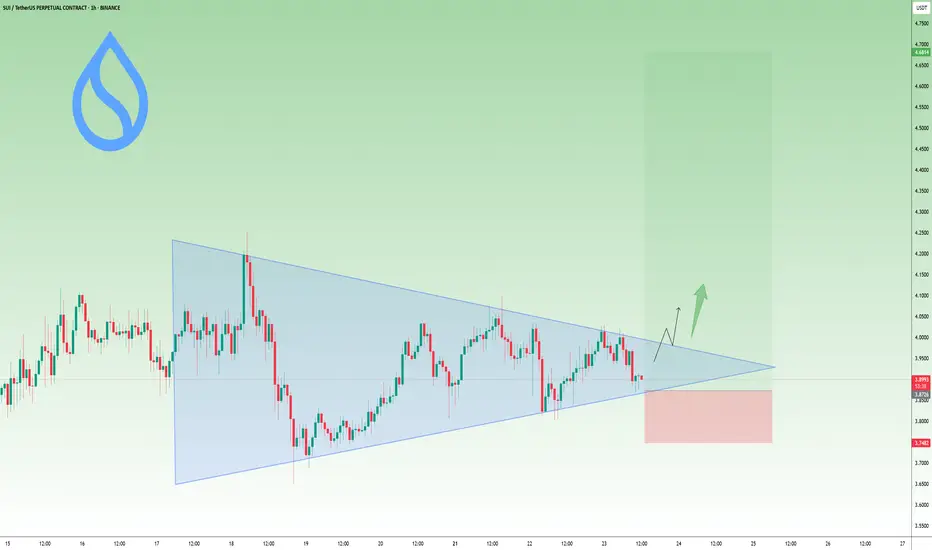
SUI – Preparing for a Breakout? Symmetrical Triangle in PlaySince the beginning of the year, SUI has been consolidating inside a classic symmetrical triangle — marked by higher lows and lower highs, a sign of tightening price action and growing pressure.
This kind of structure doesn’t last forever.
Usually, it ends with a strong breakout — especially if supported by volume.
🔍 What to watch:
- A break above the upper trendline could trigger a strong move, with potential targets in the $5 area and even a new ATH, if altcoins enter a real revival phase.
- On the flip side, $2.80 remains the key support level.
As long as it holds, bulls remain in control of the structure.
📍 My game plan:
I’m watching the $3.25 area as a potential buy zone —a great spot inside the pattern, offering tight risk and strong upside if the breakout comes.
Until then, it’s all about patience.
Pressure is building. The triangle is tightening.
And the market is waiting for a reason to move.
Lingrid | SUIUSDT Buying Opportunity from Support ZoneBYBIT:SUIUSDT is pulling back from the recent range top after testing the resistance zone and is approaching the key breakout area. The structure shows an upward channel with a prior consolidation breakout and an ongoing corrective retracement. As long as the price holds above the confluence zone near 3.35, the bullish structure remains intact. Broader momentum supports trend continuation toward the upper resistance boundary and the target area.
📉 Key Levels
Buy trigger: Break above 3.75 with volume
Buy zone: 3.25 – 3.35
Target: 4.24
Invalidation: Break below 3.22
💡 Risks
Breakdown below channel support would flip structure bearish
Fading volume on bounce may signal exhaustion
Broader market weakness could suppress upside momentum
If this idea resonates with you or you have your own opinion, traders, hit the comments. I’m excited to read your thoughts!

Tension Builds on SUI Chart — Eyes on $3.85CRYPTOCAP:SUI is moving inside a symmetrical triangle pattern.
The price is getting tighter, forming higher lows and lower highs.
This usually means a breakout is coming soon.
If it breaks above the triangle with strong volume, SUI could jump to the $4.60–$4.70 range.
For now, it’s a wait-and-watch setup.
Key support is just below $3.85, staying above that keeps the bullish trend alive.
#Altseason2025
SUI 5R setup forming.SUI looks ready to move. Wait for a breakout above $4 — once it flips the $4.10 resistance, it could fully send toward ATH.
Entry: $4
Stop Loss: $3.70
Target: $5.30
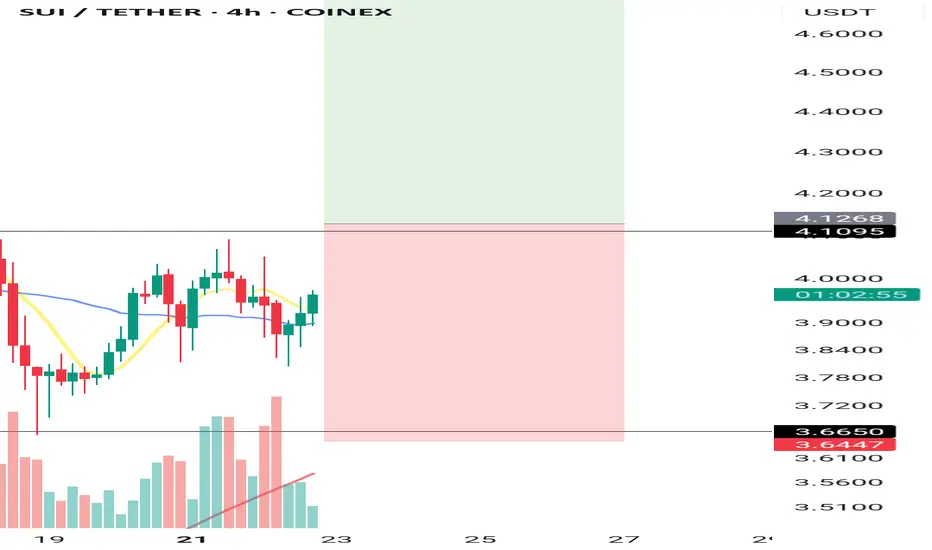
Technical Analysis – SUI/USDT long position (4H Timeframe)
🚀 Technical Analysis – SUI/USDT (4H Timeframe)
🗓 Date: July 22, 2025
📌 Suggested Entry:
$4.12
🎯 First Target:
$5.10 – Risk to reward ratio ≈ 1:2 ✅
🛑 Stop-Loss:
$3.60
---
🔍 Entry Conditions:
✅ If there is strong volume and momentum:
Enter on breakout of the $4.12 level in the 1-hour timeframe
🟡 If the move is slow and volume is low:
Only enter after a candle closes and holds above $4.12, preferably in the 4-hour timeframe
---
📊 Macro Structure Analysis:
🟦 SUI/BTC:
Still in an uptrend with higher highs and higher lows ⬆️
But early signs of trend weakness are showing ⚠️
📈 BTC Dominance (BTC.D):
❗ If 61.31 breaks → stop-loss might be triggered
✅ If 60.42 breaks → supports holding the long position
🌐 TOTAL2 (Altcoin Market Cap):
If it breaks above 1.55 → confirms long entry ✅
💵 USDT Dominance (USDT.D):
Currently in a key zone between 4.26 – 4.14
If a red candle breaks 4.14 🔻 → strong bullish sign for altcoins and a good setup for a long on SUI 💥
---
🎯 Final Strategy and Personal Plan:
I will only enter the trade if all of the following are true:
1. Macro indicators are in favor of altcoins ✅
2. Strong volume and momentum come into the market 🔥
3. Breakout of $4.12 happens with strong and sharp candles 🚀
If the move is slow or macro signals are weak ❌,
I will cancel the trade and ignore the setup.
---
📵 Invalidation:
If SUI can’t break above $4.12, even when macro indicators are bullish, and the market lacks momentum.
---
📣 If this style of analysis helped you, don’t forget to follow ❤️
Leave a comment and share your thoughts 💬
And if you found it useful, hit that rocket so we can fly 🚀