sui usdt"🌟 Welcome to Golden Candle! 🌟
We're a team of 📈 passionate traders 📉 who love sharing our 🔍 technical analysis insights 🔎 with the TradingView community. 🌎
Our goal is to provide 💡 valuable perspectives 💡 on market trends and patterns, but 🚫 please note that our analyses are not intended as buy or sell recommendations. 🚫
Instead, they reflect our own 💭 personal attitudes and thoughts. 💭
Follow along and 📚 learn 📚 from our analyses! 📊💡"
SUIUST trade ideas

The trend is bearish1.divergence in price is observed.
2.triple top pattern is completed.
3.be ware.....the trend is bearish.
4.best position for sellllll.

CRYPTO SUI USDT - Ascending triangle. Get longSUI is forming a nice ascending triangle on the 4H chart. This is a high probability pattern. We set out stop at the previous low. RSI is stronger on the previous low meaning selling strength is weaker. STO has bottomed and we are at the support line of the triangle.
It all points to a 32% no leverage gain in a short time period.
Pattern: Ascending triangle.
RSI. Only fell to 44 on previous low.
STO: Is below 10 said ready to bounce up
Volume: Green candles are dominating right now.
Buy: 4.65 now
Target 6.15
Stop loss 4.29

SUIUSDT: 3X expected in upcoming Bull run!!Join our community and start your crypto journey today for:
In-depth market analysis
Accurate trade setups
Early access to trending altcoins
Life-changing profit potential
Let's analyse SUIUSDT both fundamentally and technically.
FUNDAMENTAL ANALYSIS:
SUI is a promising blockchain platform developed by Mysten Labs. Known for its high throughput, scalability, and focus on developer experience, SUI aims to provide a robust infrastructure for decentralized applications.
Key features of SUI include:
High Performance: Handles a large number of transactions per second.
Smart Contracts: Supports self-executing contracts for building dApps.
Developer-Friendly: Offers a user-friendly environment for developers.
Security and Efficiency: Prioritizes security and efficient transaction processing.
SUI's innovative approach could position it as a leading player in the blockchain space.
TECHNICAL ANALYSIS:
SUI has exhibited a bullish breakout on daily timeframe. The recent breakout from a parallel channel on the daily chart, coupled with a symmetrical triangle pattern on a lower timeframe, suggests a potential uptrend.
Key technical indicators supporting this bullish momentum include:
Price Action: SUI is trading above the 200-day moving average.
Volume: A significant increase in 24-hour trading volume of more than 100%.
Chart Patterns: The breakout from the parallel channel and symmetrical triangle suggest bullish momentum.
If SUI maintains its current momentum, it could potentially experience a significant price increase in coming weeks.
Buying Levels:
$0.9997 to $0.7566
Target Levels:
$1.1812
$1.7141
$2.1633
$3.0457
If you find this analysis helpful, please hit the like button to support my content! Share your thoughts in the comments and feel free to request any specific chart analysis you’d like to see.
Happy Trading!!

update(Long-term analysis)The price has reached the ceiling of its long-term channel/ if it exits from the first channel, the price will have the potential to grow up to the ceiling of the second channel over time and with the usual fluctuations of the market

SUI LONG H1Crypto Introduction
Sui is a first-of-its-kind Layer 1 blockchain and smart contract platform designed from the bottom up to make digital asset ownership fast, private, secure, and accessible to everyone. Its object-centric model, based on the Move programming language, enables parallel execution, sub-second finality, and rich on-chain assets. With horizontally scalable processing and storage, Sui supports a wide range of applications with unrivaled speed at low cost. Sui is a step-function advancement in blockchain and a platform on which creators and developers can build amazing, user-friendly experiences.

#SUIUSDT 1 DAYSUIUSDT Daily Analysis
The SUIUSDT pair is forming a rising wedge pattern on the daily chart, which often indicates a potential bearish reversal. The price is approaching the wedge's support line, and a breakdown below this level would signal increased selling pressure, offering a strong sell opportunity.
Technical Outlook:
Pattern: Rising Wedge
Forecast: Bearish (More Sell Opportunity upon Support Breakdown)
Entry Strategy: Enter a sell position after the price breaks below the wedge's support line and confirms the breakdown with bearish price action, such as a strong close below the support or a retest of the broken level.
Traders should use indicators like RSI or MACD for confirmation of weakening bullish momentum. Proper risk management is critical, with stop-loss orders placed above the wedge and profit targets set at key support zones below.

The Most Perfect Entry on SUI/USDTI basically found a perfect entry right when the reversal began on the 4hr chat. From my graph, you can see the clear support level, where the price bounced off of it twice already. If it were to break this support level that would be a different story, but since I saw it only bounced off of it, thats when i knew this was going to be a perfect entry.
So I entered at 4.36 and has a SL at 4.35. I knew there wasn’t going to be a dip to the downside, and if it did, I wouldn’t want to be in the trade anyway.
So perfect entry, now what about profits?
Looking at the entry, I decided to put my TSLA at 4.425 Based off the 30 minute Time frame to lock in my profits since im already in the green.
Since I had such a perfect Entry, The profit on this could be like a 20x. Depending on how far this goes in my favor. We’ll watch the charts and see how it goes.
YOU CAN STILL ENTER LONG. JUST BE READY TO HAVE A STOP LOSS AT 4.5


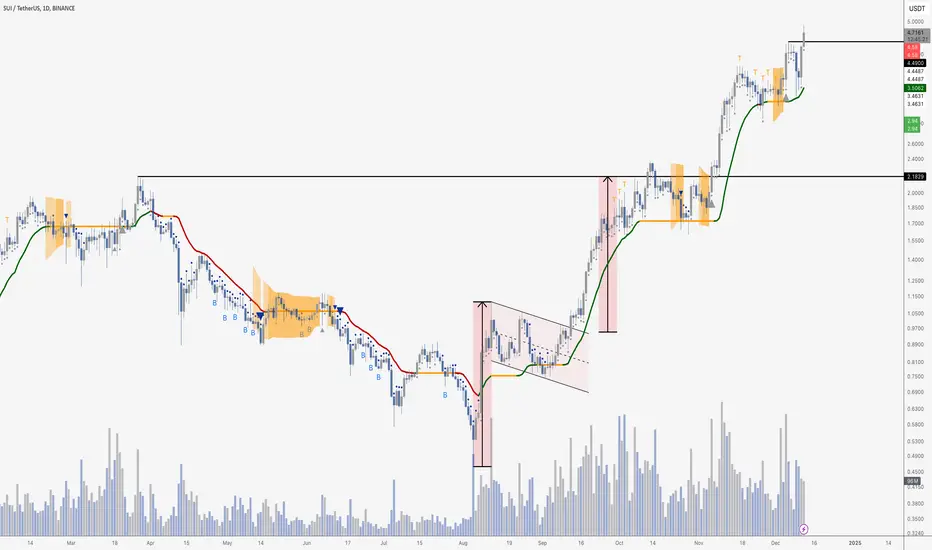
Lingrid | SUIUSDT rolled back After Reaching NEW Highs The price perfectly fulfills my last idea. It hit the target level. BINANCE:SUIUSDT pulled back without reaching the psychological level of 5.00. Instead of making a new higher high, the price formed a double top and rolled back. I anticipate that the market may pull back toward the support level around 4.00. If the price bounces off this support level or creates a trend continuation pattern, I expect the market to continue moving higher. My goal is resistance zone around 5.00
Traders, if you liked this idea or if you have your own opinion about it, write in the comments. I will be glad 👩💻

SUI if the bears come to the partyHey I love SUI as much as anyone, and yes I believe it will hit $6.00...but just look at this chart and understand that what I am presenting here could play out.
Trade Spot my Friends.....
I would not leverage on SUI right now.
Best wishes to all.

SUI looks BullishBINANCE:SUIUSDT
SUI has recently experienced a strong rally, but it’s now facing resistance at $4.8, with several candles showing rejection at this level. If SUI breaks this resistance and closes above it, the next targets could be $7 and then $10.
However, watch out for hidden liquidity below the trendline market makers might target that liquidity by triggering ST L before pushing the price higher

sui - growth to $10Well, here the closest goal in the short term is $6, but I’m still waiting for $10-12


SUI is at dangerous levels. caution is to be hadSUI is strong! but a deeper correction is still on the table for it

SUI: Short term running out of steam?SUI remains in a bullish structure, but the confluence of resistance signals—RSI levels, Fibonacci extensions, and historical patterns—suggests a temporary pause or pullback. If other altcoins present better setups, it’s wise to consider reallocating. Additionally, retaining a portion of SUI for the potential continuation of the 4-year cycle rally aligns with a balanced risk strategy.
Healthy Moving Averages: The position of moving averages on daily and weekly timeframes indicates the uptrend remains intact, offering potential for continued bullish action.
RSI Considerations:
Daily RSI Convergence: Suggests momentum is slowing as price approaches resistance. This could lead to a reversal or consolidation.
Weekly RSI at 80: Historically, this level has coincided with peaks in price action, signaling overbought conditions.
Fib Extension Target: Price hitting the peak Fibonacci extension from the first pump confirms a key resistance level. This often acts as a natural barrier where profit-taking occurs.
Historical Behavior: SUI’s tendency to lead altcoin rallies and its earlier slowdown in early 2024 suggests a repeat cycle where it might again cool off before other assets.
4-Year Cycle Potential: While there’s room for another major run to the upside, the signals you’ve highlighted suggest a short-term pullback or consolidation phase before the next move.
Additional Considerations
Profit-Taking Strategy: Rotating profits into stronger or earlier-stage setups within the altcoin market may optimize your returns while mitigating risk.
Market Sentiment: Broader market dynamics (e.g., BTC dominance, macroeconomic conditions) could influence SUI’s trajectory and its correlation to other altcoins.
Volume Confirmation:
Monitor for any divergence between price action and volume; declining volume on upward moves could signal weakening momentum.

SUI price smashed a new ATHSince the markets recovered after gaining some momentum in recent days, altcoins have gained significant traction. In the meantime, the SUI price attracted a huge buying volume as the trading volume surged by above $3.6 billion. As a result, the price led an impressive 35% rise since the last trading day and smashed a new ATH at $4.86. After achieving fresh highs, the token does not appear to halt its rising trend, as the bulls are eyeing much higher targets well above $5 or $6.
The historical price action of the token suggests a breakout from a huge bullish pattern and as a result, a steep ascending trend could be fast approaching. The token broke out of the double-bottom pattern and after a small retracement, it has begun to swell. The technicals are currently extremely strong, which supports the bullish narrative. Hence the token is believed to maintain a healthy ascending trend as the RSI has made it to the overbought zone. As the levels are not displaying any possibility of a bearish divergence, the SUI price is expected to maintain a healthy upswing.
Besdies, the rising on-balance volume or OBV, supports the bullish narrative, which suggests the rally to be in a progressive stage. The token has already reached the 1.2 FIB at the current highs and the next level to watch is around $5.34, which is at 1.414 FIB. However, the major target remains at around 2 FIB at $2 and securing these levels could attract some bearish action, which may halt the steep ascending trend.
If the market continues to possess strong bullish momentum, then the SUI price rally may revamp a strong rebound and proceed towards the $10 milestone that could be the peak of the prevailing bull run.

SUI BREAKS OUT AGAINAnother all-time high for SUI! If you followed my briefly existing website, you may recall the videos I made about this when it was trading below a dollar and forming a massive bull flag. That pattern hit its target at $2.18… and then kept climbing.
SUI is once again breaking into uncharted territory, poised to continue leading the market. To confirm this momentum, we’ll want to see the daily close hold above $4.49 to avoid a potential fakeout.
Sui 300% for one monthAccording to the chart we have two sharp movements till 8 and after a little pulback we can go to the 12 , and macd has a strong cross above the line that prove that strong momentum . So what do you want to do?

SUI Turns Bullish (Market Update —Adapt & Change)Together with Bitcoin, SUIUSDT (Sui) is now growing strongly above a previously defined resistance level turned support.
The resistance in question was the March 2024 high (peak price). SUIUSDT broke decisively above this level which is now considered support (blue line). Any drops or retraces and this is the main level that will be tested. Any retrace or correction can be used as an opportunity to buy or go LONG.
Resistance is being challenged right now around $3.24. The next major target after this one is $4.97. Additional growth is possible long-term.
The Cryptocurrency market is now bullish. Bitcoin is bullish. The Altcoins are bullish. Adapt and change.
Thank you for reading.
Your support is appreciated.
Namaste.

SUI Swing ltf setupHere I see an opportunity for a sui long position starting with an entry at 50% of the ote that nicely aligns with a set of orderblocks that overlap themselves, I will target the bearish fvg bottom as my primary goal and I have also set an extension level of 120% on the fib as a possible secondary target SL at the recent swing low within the swing range I have marked out

SUI Swing ltf setupHere I see an opportunity for a sui long position starting with an entry at 50% of the ote that nicely aligns with a set of orderblocks that overlap themselves, I will target the bearish fvg bottom as my primary goal and I have also set an extension level of 120% on the fib as a possible secondary target SL at the recent swing low within the swing range I have marked out
