I went Short here's why...First of all, I know that this is a risky position to be in, but I decided short anyway.
It is easy to locate past final highs; so, we safely can say that the point of analysis is to find highs in the future.
I might be wrong, but for the period of this week, and maybe the week after, I've decided to go short. But I don't know about after next week.
Shift your Stop-loss according to movements.
Don't put a Take-profit until you're concrete and, don't look back.
Stay responsible and, stay relaxed. 👍🏻
SUIUST trade ideas

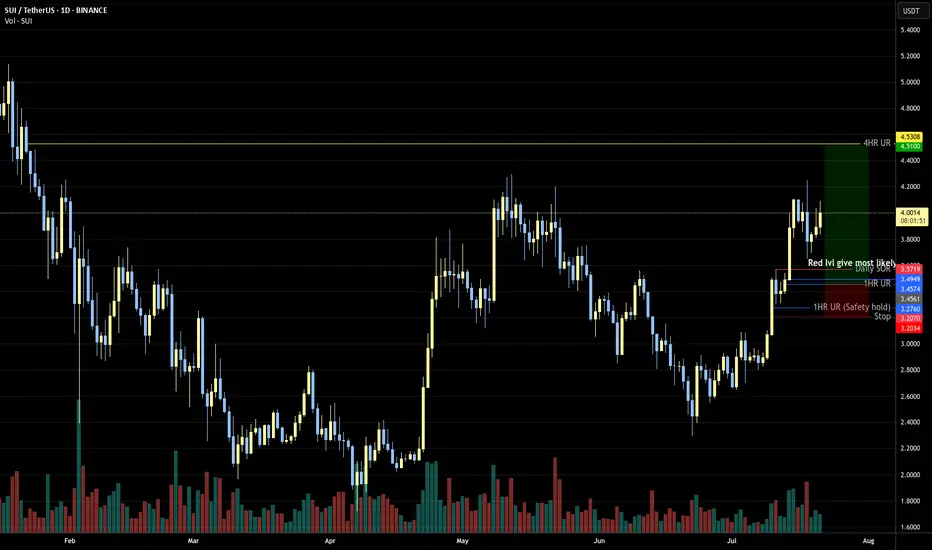
2.5-4RRI believe this can fill in the next day or 2, RR depends on the lvl taken, Sui is currently in a very bullish move so it makes sense to take the higher red lvl for lower RR IMHO.
SUI/USDtSUI is looking bullish from here! We might see some consolidation still before we move higher. Great coin to hold for the next 4-6 months!
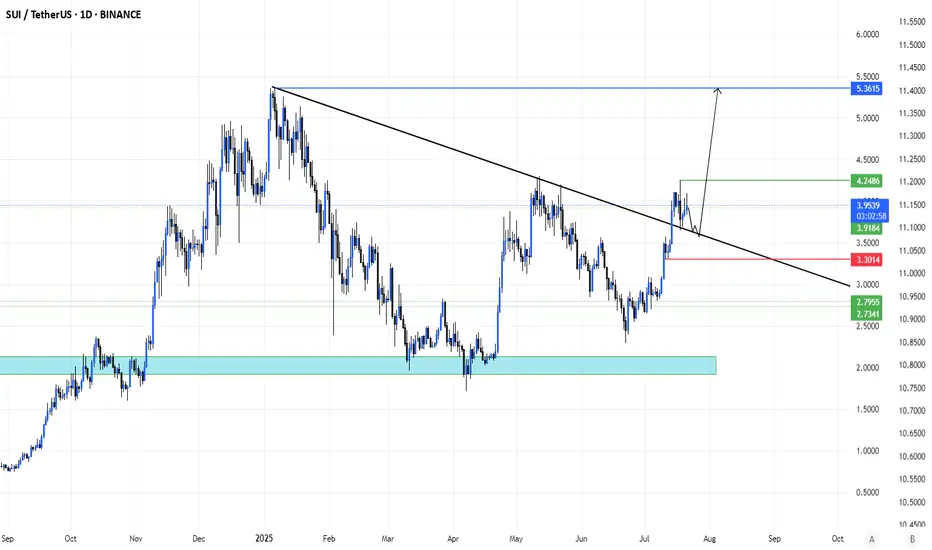
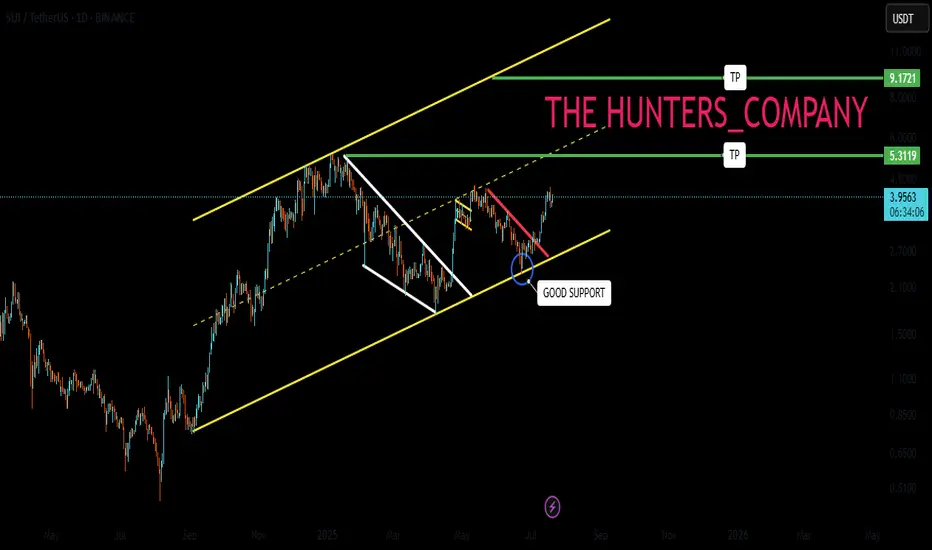
SUI trade setup with a 7:1 risk-to-reward ratio.SUI has broken out and retested the major channel. If you're bullish, this 7:1 R:R setup is worth considering.
Entry: 3.94
Stop Loss: 3.77
Target: 5.30.
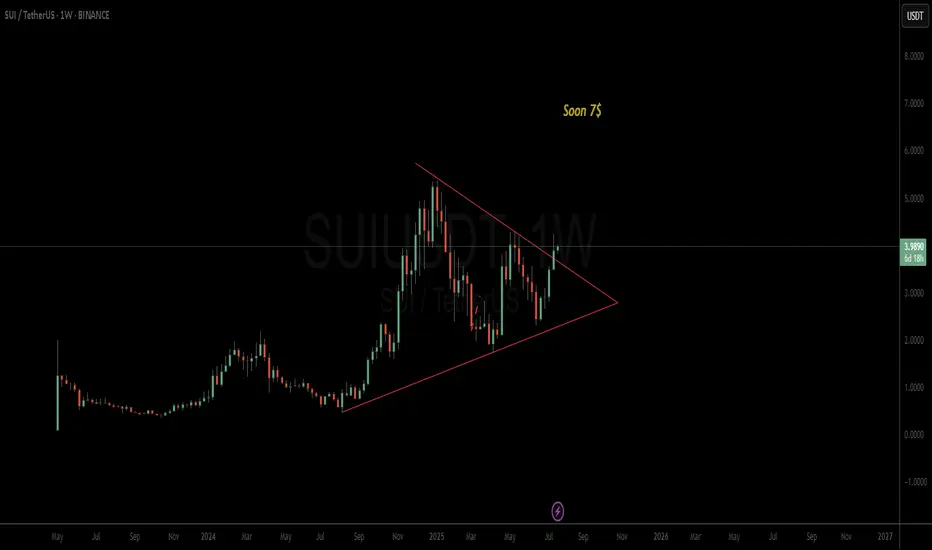
SUI potentail to 7$The chart is clear, folks
The triangle broke, and SUI has the potential to rise to 7$
Good luck
$suilong this bubba
weekly close might sweep liquidity so keeping some for there
targeting ATH
shall post HTF chart

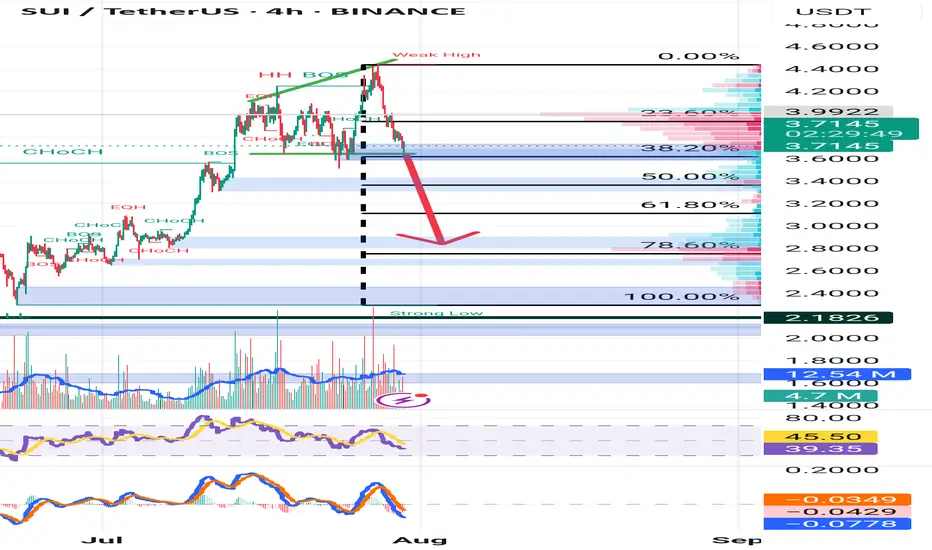
SUI 4H – Rejected From Resistance, But Fib Golden Pocket NearSUI just cleanly rejected from a major supply zone near $4.40 — now pulling back into a deep retracement zone that’s historically acted as support.
The 0.5–0.786 Fibonacci levels align perfectly with a previous structure zone, making this a key area for potential bounce setups.
🔹 0.5 = $3.09
🔹 0.618 = $2.77
🔹 0.786 = $2.31
Momentum indicators like Stoch RSI are also rotating downward, suggesting room for a full reset.
⚠️ If buyers step in at the golden pocket, expect volatility. If not — we could revisit May’s lows.

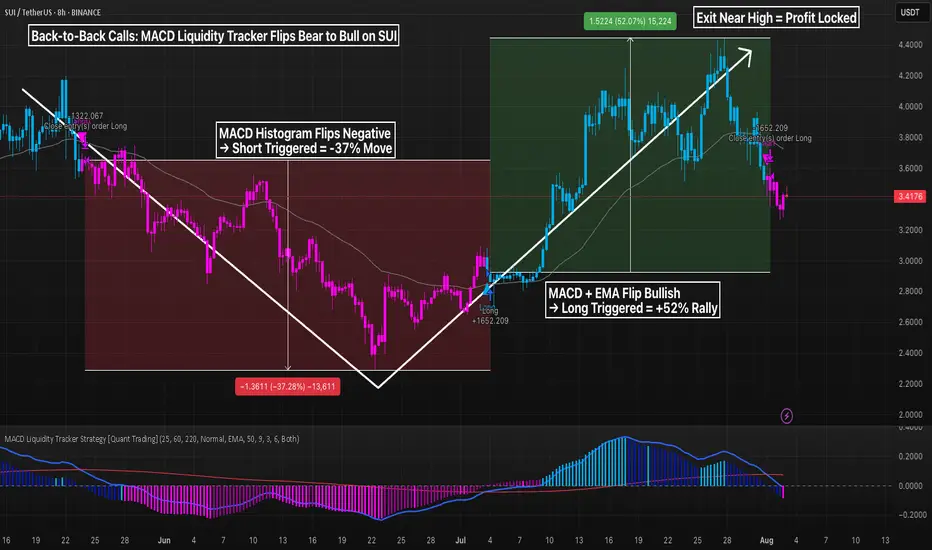
Back-to-Back Calls MACD Liquidity Strat-> Bear to Bull on SUIWhen the market flips, most traders get stuck holding bags.
Not here.
The MACD Liquidity Tracker Strategy flipped short near the top and long near the bottom — catching a clean -37.28% drop followed by a +52.07% rally on SUI 8H.
Here’s how it works:
– EMA filter confirms direction
– MACD histogram + crossover signals timing
– Strategy waits for true momentum before flipping
You don’t need to predict the bottom. You need a tool that reacts fast enough to capture moves, but slow enough to ignore noise.
⚙️ Settings Used:
– MACD: 25 / 60 / 220
– EMA Filter: 50 / 9 / 3
– Entry Mode: Both (Histogram + Crossover)
This is what smart automation looks like: fewer trades, more clarity, and real trend capture.
sui/usdt 4h analysis run for 10-15 days soon it will touch golden zone but point of invalidation will be updated soon after btc closing and others.d vs btc.d thats how i analyse but DYOR b4 jump and manage your trades accordingliy its financial ocean
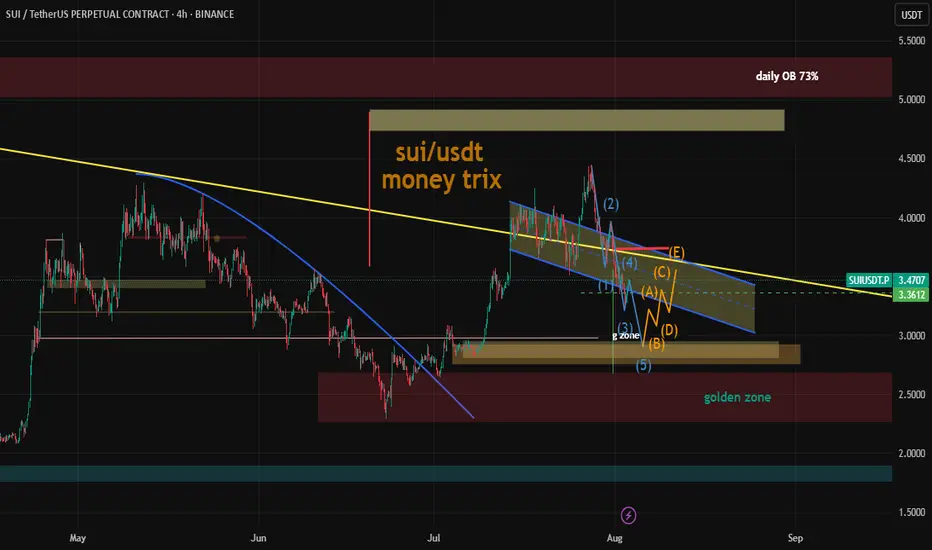
Sui chance for +60% on this zoneSui continue to grap liquidation but on the monthly and weekly timeframe we are still bullish.
I just saw good zone for trade. At 3.15 we have daily EMA + fibonacci 0.64 + Daily FVG.
I will suggest to add some leverage because invalidation is close to 2.9.
In this mid term bull market of altcoins we can see that SUI has good performance.
Ivan

SUI Swing Buy / Long SetupSui is on Strong and decision Order block on 1 day Timeframe, If we break this then SUI will take correction till recent weekly low. If we hold this then new ath. Book some or 80% on mentioned area, rest hold till 6$.

Break down to major support levelHere we have an expanding bearish wedge forming beautifully. My target is based off the 5 minute chart and a bullish order block.
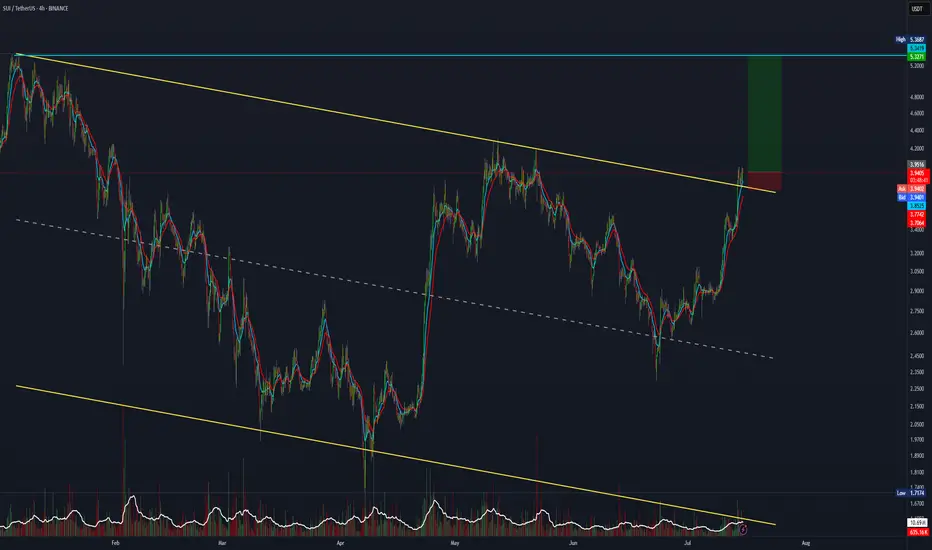
Sui (SUI): Targeting $4.20 | Bullish ScenarioWe are seeing the possibility for upward movement here, which could result in +20% of market price movement from our entry.
As of now it is too early yet to talk about any bullish movement here so we are waiting patiently for a proper breakout from our entry area, which would then give us a proper chance for bullish movement from there.
Swallow Academy

Long SUISUI had broken the 1D resistance of a Cup & Handle pattern.
Long setup is as in chart.
Disclaimer:
This analysis is based on my personnal views and is not a financial advice. Risk is under your control.

SUI : HODL BASKETHello friends🙌
🔊We have come to introduce a signal that can be a good option for your investment portfolio.
Given that the price is in the ascending channel and has good support from buyers, it is expected that this time the price will break the middle line of the channel and move to the ceiling of the channel and succeed in reaching ATH...
Don't forget about capital and risk management.⚠
🔥Follow us for more signals🔥
*Trade safely with us*
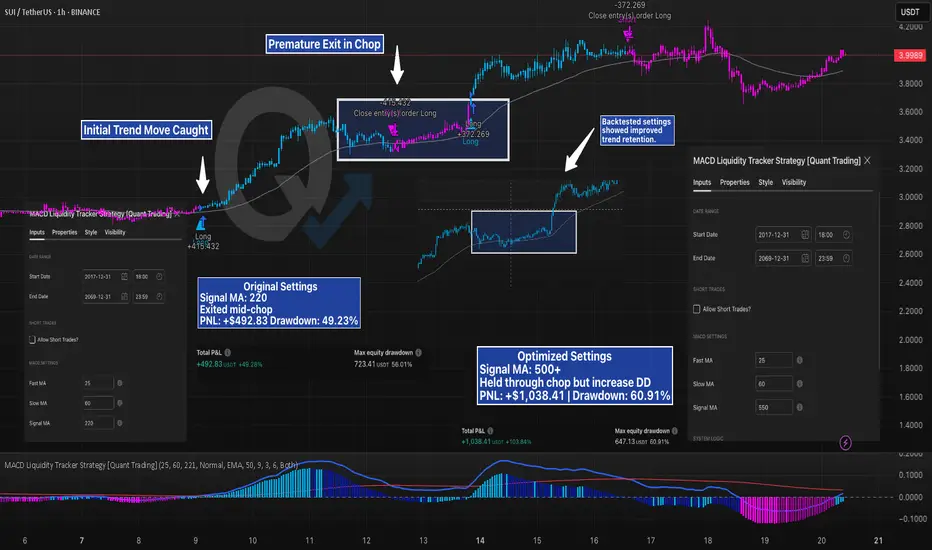
Mid-Chop Exit vs Trend Hold — How One Setting Changed EverythingSUI’s trend looked solid — but the strategy didn’t hold.
Using the MACD Liquidity Tracker Strategy with default settings (Signal MA = 220), the system caught the initial move well, but then exited during consolidation. It missed the continuation and had to re-enter late — resulting in more trades and reduced edge.
After running a few backtests, we increased the Signal MA to 550 to reduce early exits. The result:
Strategy held through the mid-trend chop
PNL more than doubled
Drawdown increased slightly, but the trade stayed intact
This is a perfect case study on how signal sensitivity affects trend behavior. Faster MAs respond quicker but tend to exit on noise. Slower MAs smooth it out — at the cost of larger swings.
Both versions are valid — but backtesting revealed which better fit this market structure.
No settings are one-size-fits-all — the key is understanding how each tweak behaves.
—
#SUIUSD #CryptoTrading #Backtesting #MACDStrategy #StrategyTweaks #LiquidityTracker #TradingEdge #QuantTradingPro #TradingView #TechnicalAnalysis
fthjgyfghjSUI is currently trading near the resistance line. Price was reject around this resistance line in the previous pump.
- Given the current bullish market, price is expected to breakout from this resistance easily
Entry Price: 4.04
StopLoss: 3.2
TP1: 4.5059
TP2: 5.3810
TP3: 6.5106
TP4: 7.8772
TP5: 10+
Don't forget to set stoploss.
Stay tuned for more updates
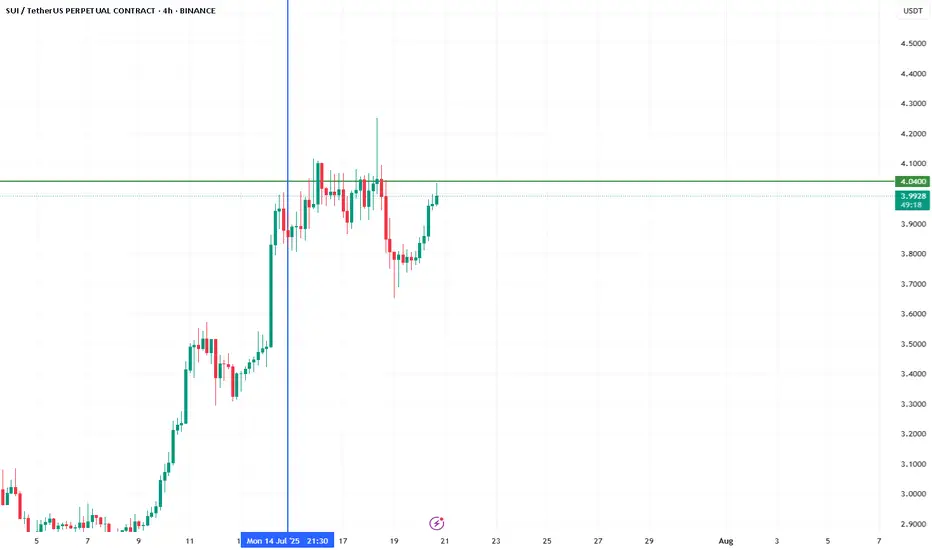
SUI - Breakout of the yearSUI is currently trading near the resistance line. Price was reject around this resistance line in the previous pump.
- Given the current bullish market, price is expected to breakout from this resistance easily
Entry Price: 4.04
StopLoss: 3.2
TP1: 4.5059
TP2: 5.3810
TP3: 6.5106
TP4: 7.8772
TP5: 10+
Don't forget to set stoploss.
Stay tuned for more updates

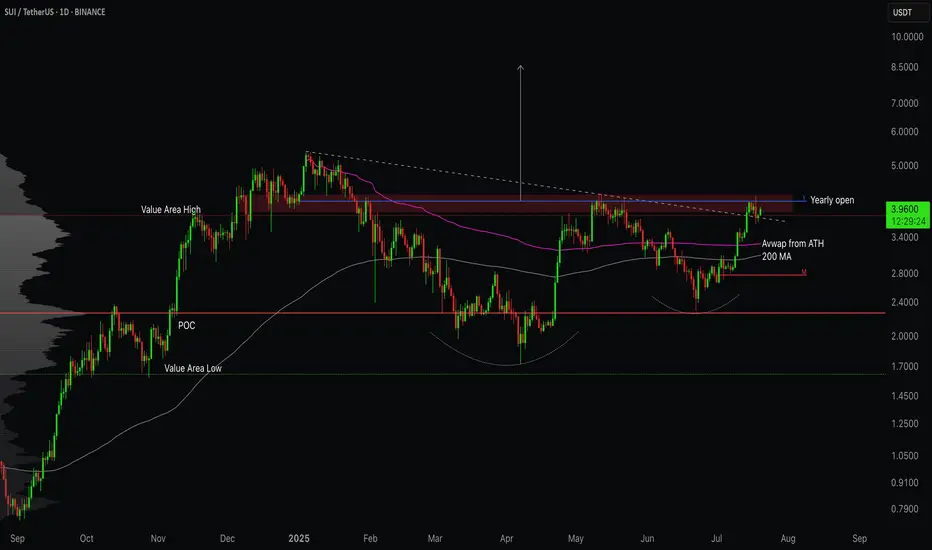
SUI/USDT - Testing the Top of ValueSUI is back in focus as price pushes into a critical zone of resistance that has capped previous rallies. With key moving averages reclaimed and volume shifting in favour of bulls, the question now is simple - can it break free, or is this another trap before rotation lower?
Let’s break down the current structure and what comes next!
SUI is trading at a critical inflection point after staging a strong recovery off the March and April lows . The broader context shows a market transitioning from a bearish phase into a more constructive accumulation structure. The recent price action has been guided largely by reclaiming key areas of previous acceptance and value.
However, sellers are still active at the upper bounds of this range. The next few sessions will determine whether SUI transitions into full breakout mode or requires further consolidation below resistance.
⦿ Volume Profile
The Value Area Low (VAL) is anchored around $1.62 . This area marked the exhaustion point for sellers, triggering the current recovery leg.
The Point of Control (POC), which represents the highest traded volume zone, sits at approximately $2.27 . This zone acted as a magnet for price through May and June and is now firmly reclaimed, reinforcing its importance as a structural support.
The Value Area High (VAH) comes in at $3.82 . Price has recently reclaimed this level, which suggests buyers have shifted control of the auction. Acceptance above the VAH often implies that the previous range is no longer valid and a new range expansion could be underway.
⦿ Key Technical Insights
Several technical levels align with this recovery. The 200-day MA and the anchored VWAP from the all-time high converge between $3.00 and $3.50. This area has been successfully reclaimed and held, adding further conviction to the bullish case.
Above current prices, $4.12 represents the Yearly Open and a clear horizontal supply level. The market has shown hesitation here, as expected. The price action suggests sellers are attempting to defend this zone, but the overall structure remains bullish as long as higher lows are maintained.
Support levels to monitor include $3.82, the Value Area High, and $3.50, where both the VWAP and the 200-day Moving Average provide dynamic support. Below that, the POC at $2.27 remains a crucial level of last defense for bulls.
⦿ Market Structure
Structurally, the market has transitioned from a downtrend into a rounded bottom formation, which typically precedes more sustained uptrends. The higher low structure since the March lows confirms this shift. The recent push above both the POC and VAH further validates the strength of this reversal.
Volume has supported this breakout. We saw clear expansion through the $3.00 handle, suggesting conviction among buyers. The visible consolidation just below $4.12 reflects natural supply pressure but not yet evidence of distribution.
⦿ Scenarios to Consider
1. Bullish Scenario:
If buyers manage to establish acceptance above $4.12, particularly with daily closes through this level, the path higher opens cleanly. The low-volume node between $4.12 and approximately $5.00 suggests limited resistance in this zone. Price could expand swiftly toward $5.36 to $6.00 as a first target.
2. Healthy Pullback Scenario:
Should price reject the $4.12 zone, a pullback toward $3.82 or even $3.50 would be healthy and expected. As long as the structure of higher lows remains intact and price holds above the reclaimed POC at $2.27, this pullback would likely serve as a base for the next leg higher.
3. Bearish Breakdown Scenario:
A sustained loss of $3.00 would be the first real warning sign for bulls. Breaking below the POC at $2.27 would suggest a failed breakout and could see the price cycle back toward the lower end of the volume profile, targeting $2.26 or even the Value Area Low at $1.62. However, given current strength, this scenario looks less likely unless broader market sentiment shifts.
I’m primarily focused on bullish scenarios or potential pullbacks, as the current market looks stronger compared to a few months ago. I believe we’re likely to see some decent long opportunities moving forward.
Let me know your thoughts in the comments! 👇
⚠️ Disclaimer
As always, this post is purely for educational purposes. I am not a financial advisor, and nothing here should be taken as financial advice. Always consult your financial advisor before making any investment or trading decisions. Or at the very least, consult your cat. 🐱
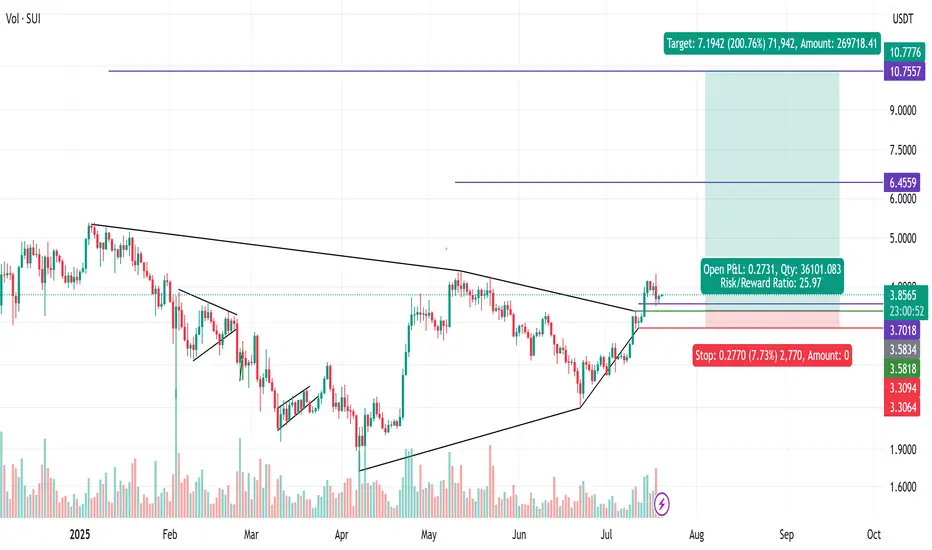
SUI - Upside continuation - with a great R/R of 26SUI has had upside buying pressure since its inception around Jun 23. I have been looking for a chance to get in and this symmetrical triangle shows it is likely to give upside continuation with a great R/R of 26.
Entry - 3.5818
SL - 3.3094
Interval 1 - 3.79
Interval 2 - 6.45
Target - 10.755
SUI: Calm Before the Wave 3 Surge?CRYPTOCAP:SUI is shaping up to be one of those charts that makes you lean in a little closer.
Right now, it appears to be sitting inside a potential wave 3, but something feels off. It hasn’t exploded yet. And when you’re looking for wave 3 behavior, that’s what you want: speed, commitment, follow-through. A clean surge, ideally in a straight line, that clears doubts and leaves the doubters behind.
We’re not seeing that yet. Right now the move is decipherable at many nested degrees making this move feel cautious.
And that opens the door to some possibilities:
It is a wave 3, just one that hasn’t lit the match yet.
We’re still nesting, multiple wave 1s and 2s stacking before the actual move hits.
Or it's a wave C of a Zig Zag.
As for levels, $4.20 stands out. Whether this turns into a rocket or a reset likely hinges on how price reacts there.
Stay nimble. If this is a true wave 3, it’ll leave no time for hesitation.
Be early, but not reckless.

SUI/USDT Perpetual (BITGET)📊 Chart Overview
Pair: SUI/USDT Perpetual (BITGET)
Timeframe: 4H
Current Price: $3.8063
Key Zones:
Demand Zone: $3.35 – $3.54 (highlighted purple box)
Resistance/TP Zone: ~$4.01
🧠 Technical Breakdown
✅ Structure & Pattern
Price has broken down from recent highs after a sharp impulse.
Now heading into a clear demand zone, with a potential double bottom or liquidity sweep pattern forming inside that zone.
The black arrows suggest a W-shaped recovery, meaning price may:
Dip into the purple demand zone
Bounce slightly
Retest the bottom again (possibly sweep liquidity)
Strong bullish reversal toward $4+
🔍 Reasoning
Demand Zone: Previously respected as a consolidation + breakout base.
Liquidity Grab Possibility: Dips below recent minor support could trap shorts.
Volume Drop + Wicky Action: Shows potential exhaustion in selling pressure.
Reversal Plan: Smart money may reload here before next bullish impulse.
⚠️ Invalidation
Clean break and 4H candle close below $3.34 = setup invalid.
Could lead to further downside into the next lower support area (~$3.00).
"Not Financial Advice"

SUIUSDTSUI has broken out above a long-term descending trendline and reclaimed the key Monthly(2) resistance at $3.71, now acting as support. After a successful retest of this level, I’m entering a long position targeting a move toward $5.00, aligning with prior highs and the next major resistance zone. The breakout is supported by strong bullish momentum, VWAP trend shift, and confluence from Fair Value Gap absorption. My stop is placed below $3.60 to protect against a failed retest, with a favorable risk-reward setup in play.
