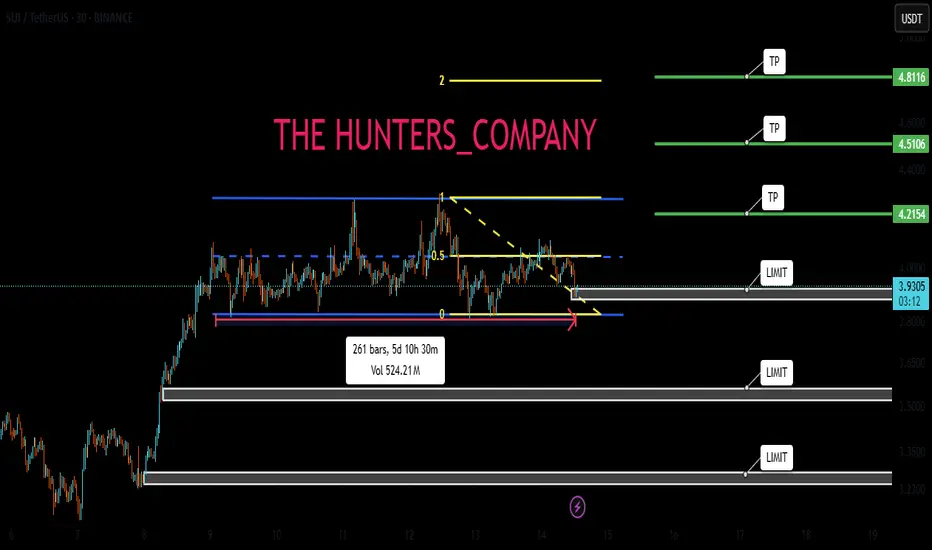
Sui long to $4.00Just opened a long position on sui. Its not the usual time for a long on the weekend but I got a few confirmations so while it feels weird am taking a risk on it.
Btc recently made ATH and it keeps going. So...expect anything.
See tp targets on chart.
stop: $3.3411 - wide and conservative
DTT strategy applied
Direction, Target and Timing
SUIUST trade ideas

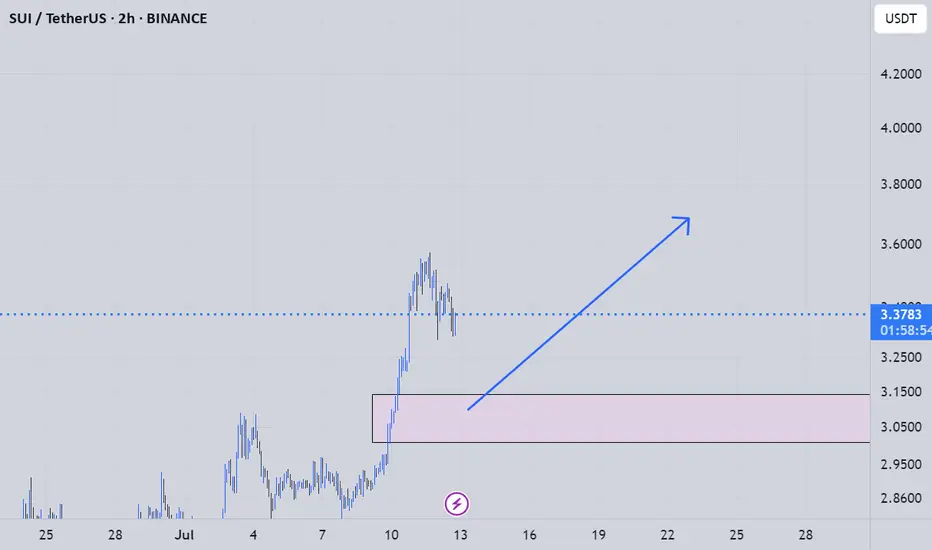
$SUI breakout incoming?Looks like SUI is having strength IMO. I wonder if the breakout confirms and holds :O

Sui Update · Clearly Moving Towards $7.62, $11.3 & $15The SUIUSDT chart looks great and just today we are witnessing a bullish continuation. Resistance was found 11-July but the market didn't produce any significant retrace. This is obviously because we are ultra-bullish and ultra-bullish can only mean sustained growth.
After the 11-July resistance, one day neutral and now resistance is being challenged again. Based on how Bitcoin is doing, a new all-time high; based on how the market is doing, great; we can expect higher prices in the coming weeks and months.
There will always be swings. Retraces and corrections but the bigger picture is a strong bullish dynamic for months. Think of 4-8 months of prices rising non-stop. That is what you are about to experience. Keeping in mind that the start date is 7-April and not today. So 6-8 months starting early April, growth long-term.
We will have a new all-time high for on this pair. There is huge potential for growth. The target on the chart is an easy one based on the short-term (within 1 month/30 days). After $7.62 we have $11.27 followed by $15. As you can see, it is still early within this bullish wave.
Thanks a lot for your altcoin choice, a great pick.
Your support is appreciated.
Namaste.

suiusdt long analysyou can use this analys for your spot trades its a longsetup for making a good profit and a getting on a big trend
Is SUI ready to surge 13% toward $3.95 target?Hello✌
let’s dive into a full analysis of the upcoming price potential for SUI 📈.
BINANCE:SUIUSDT has broken out of its descending channel with notable volume, indicating a potential shift in momentum. Price action is currently holding near a key support area, which could act as a solid base for further upside. With sustained buying pressure, a move toward the $3.95 target offering at least 13% upside remains on the table. 📈🔥
✨ Need a little love!
We pour love into every post your support keeps us inspired! 💛 Don’t be shy, we’d love to hear from you on comments. Big thanks , Mad Whale 🐋


DeGRAM | SUIUSD got out of the channel📊 Technical Analysis
● Price pierced the four-week falling-channel roof and the apex of a contracting triangle, turning 2.88 support into a launchpad and carving a sequence of higher lows.
● Breakout measured move and channel mid-band converge at 3.15; a close above there exposes the next horizontal barrier and channel top at 3.46. Risk is framed by the former triangle base at 2.88 and major swing floor 2.69.
💡 Fundamental Analysis
● Sui’s on-chain TVL has climbed >15 % since 25 Jun after zkLogin main-net rollout and Mysten Labs’ new developer grants, underpinning demand despite broad market lethargy.
✨ Summary
Long 2.90-3.05; hold above 3.15 targets 3.46. Invalidate on a 4 h close below 2.88.
-------------------
Share your opinion in the comments and support the idea with a like. Thanks for your support!

SUI - SUI SUI in your ears!Hellooo so SUII moves are marked till the blue line - as stated but beyond it if it goes just in case, you know the path

Trade Update – SUI/USDT✅ Trade Update – SUI/USDT
📅 July 11, 2025
🚀 Target almost fully hit on the 4H breakout move!
🔓 I’ve booked my profits here — solid R:R and clean breakout follow-through.
📉 Broke out of the downtrend
🔁 Retested previous resistance as support
📈 Strong bullish momentum took it straight to target
💰 Hope you’re in profit too if you followed this!
📌 Always manage your risk & lock in gains 🔐
📊 Chart speaks for itself 👇
Follow for more updates 🧠💸
#Crypto #SUI #Bitget #TradeUpdate #Breakout #TA
👉 Follow me on X for more sharp trades 🧠📈
@Ali15349323

sui new long to $3.67Just now opened up a new long position on sui.
Stop: $3.3673
Roughly 2RR.
Market might wick down a bit again but soon I anticipate a new high based on my DTT analysis

SUI - Channel Structure
SUI just printed a powerful +12.95% daily move, bouncing cleanly from the mid-range of its long-term ascending channel. This structure has been respected since mid-2023, guiding both impulse legs and corrective phases with precision.
Now trading around $3.47, the next logical magnet is the channel top near $5, especially if momentum persists and market sentiment remains risk-on.
Technical Structure:
Bullish trend within a well-defined ascending channel
Clean reaction from dynamic support (midline)
Clear higher low + breakout structure in play
Upside Target:
$5 (channel resistance)
As long as SUI holds above the rising midline (~$2.80 area), this setup remains valid for trend continuation toward the upper range.
📌 Risk Management:
Break below the midline flips the bias short-term. Until then, trend = friend.

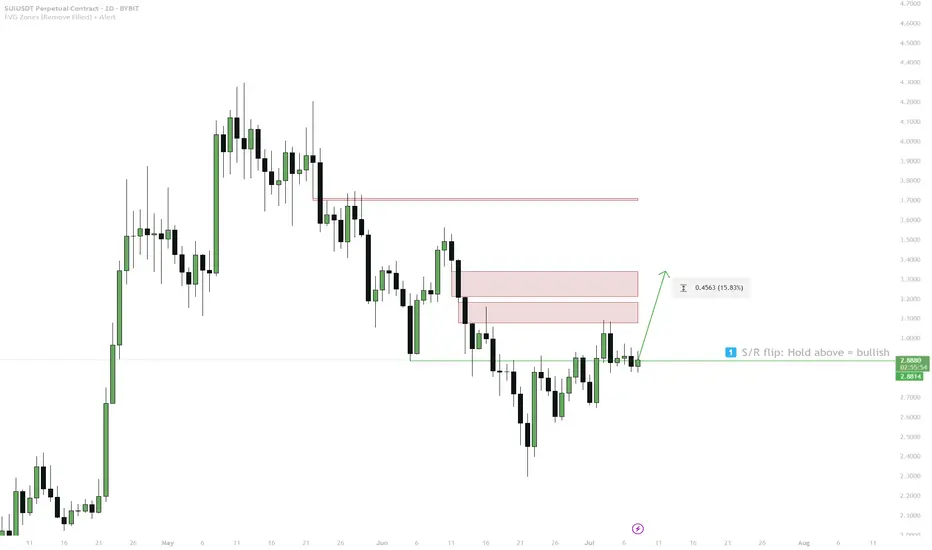
SUI — 1D S/R Flip & FVG Target1. Hold above 1D S/R + BOS (blue box) = bullish bias
2. Entry: Only long above blue box
3. Target: 3.32 (FVG)
4. Stop: Below blue box = invalid
#SUI/USDT#SUI
The price is moving within a descending channel on the 1-hour frame, adhering well to it, and is heading toward a strong breakout and retest.
We are experiencing a rebound from the lower boundary of the descending channel, which is support at 2.90.
We are experiencing a downtrend on the RSI indicator that is about to break and retest, supporting the upward trend.
We are heading toward stability above the 100 Moving Average.
Entry price: 3.00
First target: 3.07
Second target: 3.15
Third target: 3.24

SUI/USDT Trade UpdateShared this setup yesterday — today it smashed right through the resistance zone 🔥
📈 Entry: ~$2.88
🎯 Target: $3.56
✅ Already up over +10% and still running strong!
This breakout was clean after breaking trendline + retest.
Follow if you caught it or want more sniper entries like this! 💥
#Crypto #Altcoins #SUI #TradingSetup #Bitget

$SUI/USDT Technical Analysis
Major Bounce from FIBO ZONE 📈
SUI has just bounced off the golden Fibonacci retracement zone (0.618–0.786), confirming it as strong dynamic support. This move comes after a healthy correction from previous highs.
📍 Current Price: $3.0816
🎯 Target 1: $4.8865
🎯 Target 2: $7.4445
🛡 Invalidation Level: Weekly close below $2.40 may signal weakness

SUI may be ready for next moveSUI has been consolidating for last 60 days and has tested the Daily FVG couple of weeks back. It looks like it is ready for trend line BO and should give 35% profit for recent high. But be cautious of low volume in the current move. Only a close above 3.08 with strong volume can confirm this.

$SUI Swing Trade Setup – Breakout Confirmation & R/R Plan📌 Analysis Summary:
SUI has broken out of a strong falling channel structure that started in late May.
We’re now seeing a bullish breakout + retest, suggesting a potential trend reversal from bearish to bullish.
A small consolidation zone near the breakout confirms strength, supported by buyer presence near previous highs.
🛠️ Trade Plan (Swing Setup):
Entry: $2.89 (current price zone, post-breakout consolidation)
Stop Loss: $2.62 (below consolidation + last support structure)
Take Profit: $3.62 (near previous key resistance level)
Risk/Reward Ratio: ~2.7R
🔎 Key Technicals:
Breakout from downtrend channel
Consolidation above previous structure
Higher low formation visible
Volume remains steady, showing no strong rejection
🧠 Trade Management:
Partial TP can be considered around $3.30
Monitor BTC movement for broader sentiment
Break below $2.62 invalidates this setup
📈 This is a swing position, not a scalp — ideal for 3–10 day holding period if structure holds.
🛑 Always use proper risk management.
🔔 Follow for more clean setups.

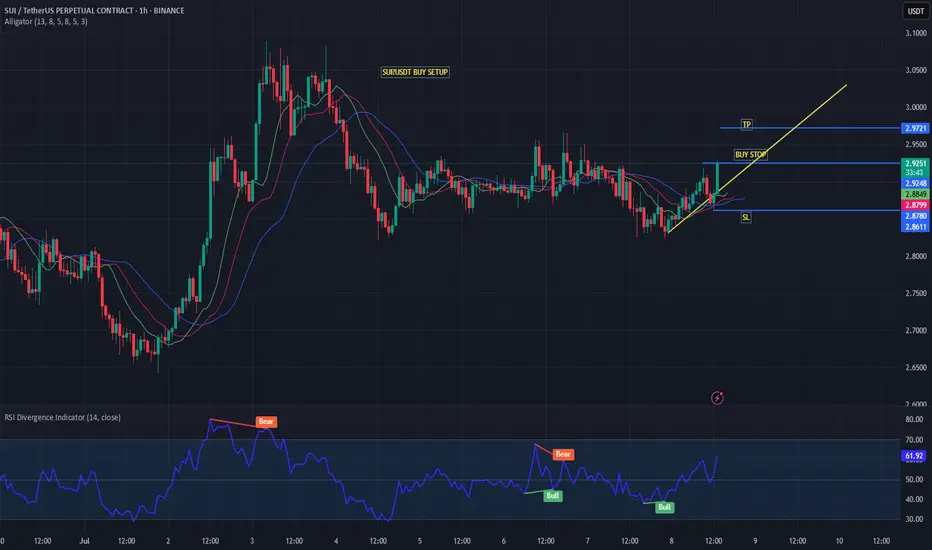
SUI/USDT 1 hour trade set-upSUI is exhibiting a potential bullish setup on the 1-hour timeframe as price begins to build momentum after a period of consolidation.
📈 Current Setup:
Price has formed a minor ascending trendline and is trading above the short-term moving averages, indicating growing bullish strength.
A buy stop is placed slightly above the immediate resistance at 2.9222, which would confirm a breakout from the consolidation zone.
✅ Trade Plan:
Entry (Buy Stop): 2.9222
Stop Loss (SL): 2.8778 (below recent swing low support)
Take Profit (TP): 2.9507 (near previous resistance cluster)
📊 Momentum Indicators:
RSI is currently at 60.19, which supports the bullish bias but is not yet in overbought territory, leaving room for an upward move.
Earlier bearish divergence has been resolved as price found support, and a bullish signal has emerged, suggesting renewed upward momentum.
⚡ Bias: Moderately Bullish
Price needs to break and hold above 2.9222 to confirm continuation toward the target zone. Caution is warranted if price fails to sustain above the breakout level.
$SUI is showing strength again. It's bouncing from a strong support zone and respecting the upward trendline, signs that buyers are stepping in.
If it reclaims the $3 level, we could see a solid move toward $5.78.
Looks like the Bulls are warming up.
DYOR, NFA.
#SUI #Suiusdt

Sui update hello friends👋
✅️Considering the drop we had, now the price has reached an important and good support and the price has been supported by the buyers and the downward trend line has broken and the ceiling has been raised. Considering this, it was possible to enter into the transaction with capital and risk management and move to the specified goals with it.
🔥Join us for more signals🔥
*Trade safely with us*

Sui long $3.02-3.09 tonightWent long Sui a while ago.
Stop: $2.8852
Tp1: $3.0213 ...75%
Tp2: $3.09 close
DTT strategy used.
Time sensitive

SUI SIGNAL...Hello friends
As you can see, buyers entered the price correction and a reversal pattern is being built...
Due to the buying pressure and the entry of buyers, we can buy within the specified ranges and move towards the set targets, of course with capital and risk management.
*Trade safely with us*

Will suffering be broken today?Hello friends
Given the good price rise, you can see that the price has entered a range, which indicates that it is gathering strength for its next move.
Now we can buy in steps with risk and capital management and move with it to the specified targets.
*Trade safely with us*