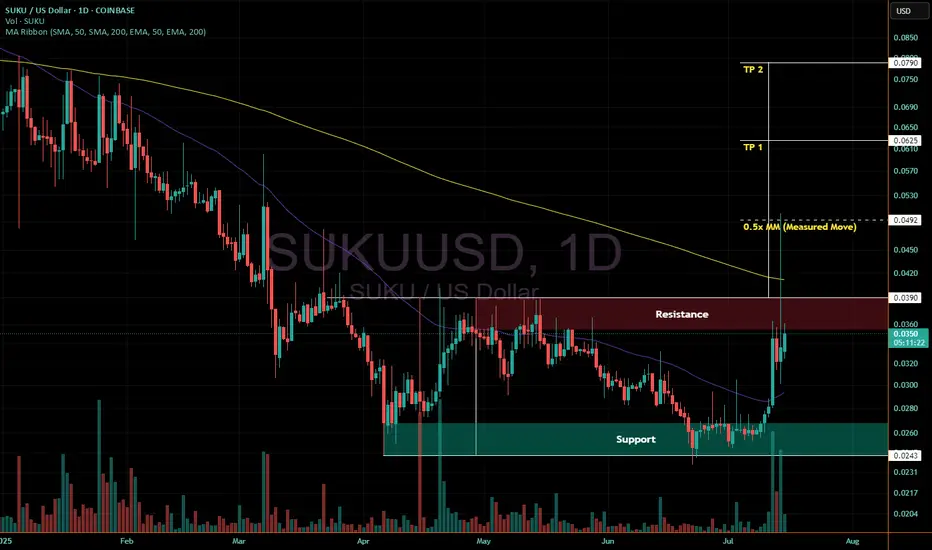
Reclaim 3.9 cents to go ~100+%Quick double bottom pattern chart for suku/usd.
It has finally seen an impulsive move up after bottoming around 2.4 cents.
That move did breach 3.9 cents and tap the 0.5x measured move towards TP 1, but hasn't yet held above 3.9 or the 200 daily EMA just above it.
It is presently pushing on resistance. As long as bitcoin holds up, a move above 3.9 and the 200 EMA that pushes on up to TP 1 and 2 seems quite likely.
If not, we may see a move back down to or even just below support for a 3rd lower low beforehand
SUKUUSD trade ideas
SUKU in ST TerritoryCOINBASE:SUKUUSD
SUKU has printed a ST in phase B of Wyckoff phases and events.
However, because Phase B is still about building the cause, this asset may still experience more shakeouts or a deeper Spring before a true markup.
I have a potential lower support structure (0:1.618 window) if that spring were to occur.
With a Market Cap of 15.7M this volatile micro-cap could bring in multipliers.
SUKU is a blockchain-based ecosystem designed to provide transparency, traceability, and decentralized finance (DeFi) solutions for supply chains, metaverse applications, and Web3 projects.
-Not Financial Advice-

SUKUUSD 12/6/2024SUKUUSD Daily Chart Analysis
• Previous Price Action:
o A significant top for SUKUUSD was established in April 2024.
o Following the top, the price tumbled through August 2024 before finding a bottom.
o From August to November 2024, the price moved sideways, signaling a potential accumulation phase.
• Breakout Confirmation:
o The accumulation phase was confirmed with an upward breakout accompanied by a spike in volume and momentum.
o In late November 2024, the price formed a bull flag pattern.
o The bull flag breakout has been confirmed, with several daily closes above the flag's top, solidifying the bullish trend.
• Momentum Indicators:
o The MACD is firmly in bullish territory, supporting continued upward momentum.
o The price is consistently supported by the 10 EMA, indicating a strong bullish trend.
• Broader Market Context:
o With BTC making strides toward new all-time highs, SUKUUSD's bullish setup is further reinforced, making this trade even more favorable.
Trade Setup (Long):
• Entry: 0.1139
• Stop Loss: 0.0883 (-22.48%)
• Target #1: 0.1918 (+68.39%, 3.04 RR ratio)
• Target #2: 0.2679 (+135.21%, 6.02 RR ratio)
This trade capitalizes on SUKUUSD's confirmed accumulation breakout, strong technical indicators, and a favorable macro context with BTC leading the crypto market higher.

Mastering Crypto Moves: Proven Strategies for Daily GainsUnlock 15% to 50% Daily Growth with Expert Chart Analysis and Market Insights
Follow me for:
🚀 Daily Crypto Predictions: Identify cryptocurrencies poised for 15%-50% moves in a single day.
📊 25 Years of Expertise: Learn from a seasoned trader with decades of experience in market analysis.
💹 Chart Mastery: Discover key patterns like Bollinger Bands, oscillators, and ICO rebound opportunities.
🧠 Real-Time Decisions: Gain insights into live trades, including entry points, profit targets, and risk management.
🤖 Navigating Market Manipulation: Understand how whale bots and market movers influence price ranges.
📈 Multi-Timeframe Analysis: Learn to analyze weekly, daily, and intraday charts for maximum synergy.
🎥 Exclusive Insights: Follow unique predictions on trending cryptocurrencies, including detailed analyses and live demonstrations.

$suku is finally going to join the post trump trend of going up $suku has been a bottom barrell sub 15m market cap coinbase coin for most of its life, i believe the new bull trend market is finally going to drag this token up into a reasonable new range outside of this low sub .08 cent sub .12 cent range . i see this hitting a dollar by years end. COINBASE:SUKUUSD

SUKU USD: Bearish 5-0 Pattern CompletionSUKU has entered into a PRZ (Potential Reversal Zone) of a bearish 5-0 pattern.
Minor Resistance around 0.08 cents with major resistance on the long term down sloping trendline.
Looking for a 0.50-0.618 retracement from the downtrend to reach levels around:
0.12-0.14 cents.

SUKU 0.095 looks like Nosana a great project and onboaerding program even for those who arent into cryptocurrency
price just broke out and only few are aware about this gem

SUKU - Breaking Out 🚀🚀🚀SUKU joins pump club today - up 50% already today.
This is a great low rank coin (currently #794) that has been drifting for some time in accumulation.
And in the end, this one was a textbook Wyckoff Accumulation as shown on the chart.
This week candle still has 5 days to go but it looks like it will be the first one with a candle body close above Accumulation Resistance.
And so it would appear that SUKU is now entering Mark Up (bull market) phase of the cycle.
This one is a rarity to have such a tidy accumulation, be so low rank and also available on the top exchange; Coinbase.
I've given some great calls to TradingView but I can't give all of them in prime position.
That said, this is probably just the beginning for SUKU 🚀.
There are still many great buys, this market is still young 👍🏻.
Not advice

SUKU Bullish AprilSUKU Bullish April?
21 million. 100+ million potential.
Low marketcap coin on coinbase.
Falling wedge chart.
Stoch Rsi = Bullish
Rsi = Neutral > Bullish
Macd = Neutral > Bullish

SUKU Bullish MarchSUKU Bullish March
Bullish chart
Lowcap coin on coinbase
Stoch Rsi = Bullish
Rsi = Neutral > Bullish
Macd = Neutral > Bullish

Suku Bullish MonthSuku Bullish Month?
Trading at $0.11
Stoch Rsi = Bullish
Rsi = Neutral > Bullish
Macd = Neutral > Bullish
Bullrun Suku 3x to 5 xBullrun Suku 3x to 5 x
Bottom chart
Marketcap now 19 million
Price $0.10
Stoch rsi Bullish
Rsi Neutral > Bullish
Macd Neutral > Bullish

Bullish March SUKUBullish March SUKU
Marketcap 18 million
Price $0.10
Potential 100 million 6x
Stoch Rsi = Bullish
Rsi = Neutral > Bullish
Macd = Neutral > Bullish

Double Bottom within a Double BottomCOINBASE:SUKUUSD looking at the possibility of the beginning of a monster move up from a double-bottom within a double-bottom.
High risk low cap - initial targets 3-4x if we get it.
Potential for the 10x move conditioned upon confirmation of the 3-4x move.
Daily double-bottom zoomed in below:

Suku Possible Falling Wedge Could Break out Probably Gonna Dump lets see if we can bust up out of this wedge, if we get rejected its back down to the bottom to pray more

Suku to 10-11 cents?Suku broke out of a falling wedge here. Earlier charts I've posted were expecting 10-11 cents, even up to 13-15. Let's see if it finally gets there after the long consolidation from its move up earlier in the year, in January.
Some confluence from the OBV indicator to support this - on balance volume has been consistently rising throughout the consolidation within the wedge. Note that last time OBV was at this level, back in January, was when we saw the last larger move up.
Going against this - DXY may be in for a strong move up soon. It could be delayed or even move down instead, but if it gets a strong move up, I imagine this is going down, or at least not going much further beyond the previously mentioned targets.
This applies to pretty much everything right now:

$suku is looking to finally move$suku has been scrapping its all time lows for months now and looks ready to finally push itself out of the trenchs

SUKUUSD long opportunitySUKU is above the daily sma.
Consolidating after the impulsive move.
Entry, targets and stop loss are shown on the chart.
Good luck

Bull FlagSuku has formed a nice bull flag here after breaking out of its falling wedge.
Confluence: Golden cross on the 50/200 day MA (dotted), and has been sitting in between the 50 and 200 day EMA for 40 straight days now, and is one of few in the crypto market that has yet to break above its 200 day EMA.
Targets remain the same as on my previous post. We could even see 15 cent area near the 200 day SMMA since this has been dragging out so long. Previous posts are here and here:
Higher targets near 15.6, but awaiting channel break:
Original falling wedge post:
Long-term, but long-shot hopium chart:

Another way to look at SUKUPreviously posted a falling wedge pattern. After breaking out of that wedge, it has formed a parallel channel (non-log chart).
I think there's a good chance we get a channel breakout as well, which would move previous falling wedge targets up a bit.
Why a good chance? SUKU has a golden cross on the 50/200 day MA (dotted lines), and is currently sitting between the 50/200 day EMA (solid). It has so far failed to drop below both the 200 day MA and the 50 EMA since moving above it. Continue to do so and we'll get our channel breakout soon.
Falling wedge's previous TP 2 was around 13.3 cents. Channel's TP 1 is around 13 cents, so that target still remains relevant. However, now we have a TP 2 from the channel break around 15.6 cents.
Previous falling wedge idea shown below, which remains in play as well:

SUKU could see 75% here, >200% if breakoutQuick post - SUKU is at the bottom of a daily chart falling wedge. OBV has been rising throughout its entire drop since first being listed on Coinbase.
A move from here towards top of wedge could easily do 65-75%, and a falling wedge breakout could lead to significantly more ~260-280%. much more if we see continuation following if such a move were to occur.

SUKUUSD bullish is an understatementThe structure of price and volume is out of this world . I will be buying every dip down into support, and expecting minimum 2x gain from here.

well shoot, i did not expect it to retrace so muchyeah i didnt make it over .10 today but it still could it pumped with BTC and when the daddy coin was rejected off 24k the market stopped $suku momentuem. im still holding
