SUN Rebuy Setup (12H)It is one of the assets owned by the creator of TRON.
It appears to be completing a large triangle and may move upward from the green zone to complete wave E.
The target could be the red box.
A daily candle closing below the invalidation level will invalidate this analysis.
For risk management,
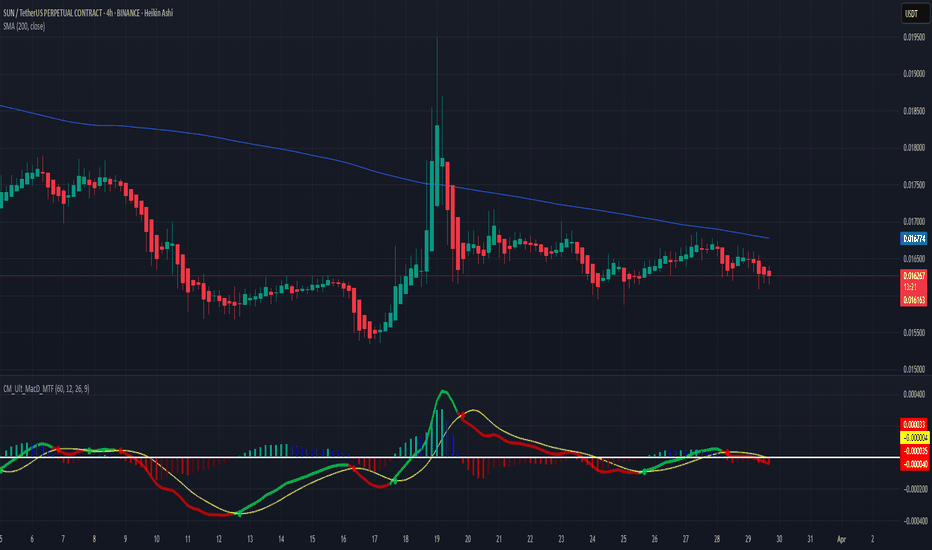
SUN/USDT 4H Chart AnalysisCurrently observing SUN/USDT on the 4-hour timeframe with Heikin Ashi candles:
1️⃣ Price Action & Trend
The price remains below the 200-period SMA, currently acting as a dynamic resistance at approximately 0.01677 USDT.
Clear short-term bearish trend structure, with lower highs visible since the
#SUN/USDT#SUN
The price is moving within a descending channel on the 1-hour frame and is expected to continue upward.
We have a trend to stabilize above the 100 moving average once again.
We have a downtrend on the RSI indicator that supports the upward move with a breakout.
We have a support area at the
SUN can pump 6 to 7x from hereThe SUN.io platform is TRON's first one-stop platform that supports stablecoin swap, token mining and self-governance. After the redenomination, the new SUN token, as a multifunctional governance token on the SUN platform (similar to the CRV token of Curve DAO and the EPS token of Ellipsis), will gr
SUN/USDTKey Level Zone : 0.026400 - 0.026600
HMT v4.1 detected. The setup looks promising, supported by a previous upward/downward trend with increasing volume and momentum, presenting an excellent reward-to-risk opportunity.
HMT (High Momentum Trending):
HMT is based on trend, momentum, volume, and marke
Sun Token ($SUN): Strategic Entry into DeFi Ecosystem TokenI spend time researching and finding the best entries and setups, so make sure to boost and follow for more.
Sun Token ( NYSE:SUN ): Strategic Entry into DeFi Ecosystem Token
Sun Token (SUN) is a crypto in the CRYPTO market. The price is 0.02420828 USD currently with a change of -0.00058 (-0.023
See all ideas
Summarizing what the indicators are suggesting.
Oscillators
Neutral
SellBuy
Strong sellStrong buy
Strong sellSellNeutralBuyStrong buy
Oscillators
Neutral
SellBuy
Strong sellStrong buy
Strong sellSellNeutralBuyStrong buy
Summary
Neutral
SellBuy
Strong sellStrong buy
Strong sellSellNeutralBuyStrong buy
Summary
Neutral
SellBuy
Strong sellStrong buy
Strong sellSellNeutralBuyStrong buy
Summary
Neutral
SellBuy
Strong sellStrong buy
Strong sellSellNeutralBuyStrong buy
Moving Averages
Neutral
SellBuy
Strong sellStrong buy
Strong sellSellNeutralBuyStrong buy
Moving Averages
Neutral
SellBuy
Strong sellStrong buy
Strong sellSellNeutralBuyStrong buy
Displays a symbol's price movements over previous years to identify recurring trends.


