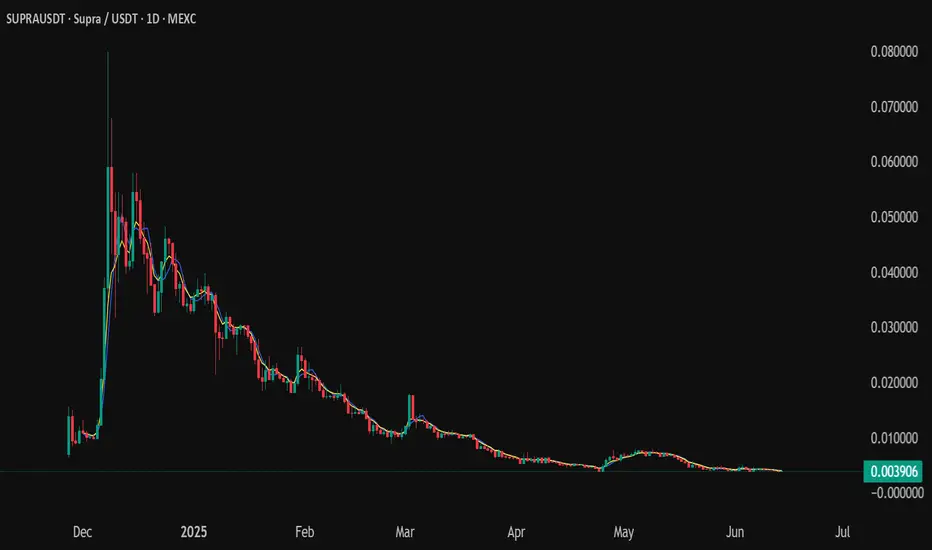
garbage!!!idk why everyone loves this token. 55M market cap and 392M full diluted. thats less than 15% of all tokens. and the chart looks like trash. why would you buy this???
chart pattern is garbage lol
Related pairs
Supra 2025 price predictions for end of yearI have a $0.28 target and a $0.53 target for end of 2025 bull cycle. I am using an extended pitch fork fib extension to help see potential targets. A very promising layer 1 with unique backing plus oracle integration into node network. These price points are extremely conservative in my opinion.

Adam Eve -Double Bottom- Bullish patternIf this not break 0.0039 support the possible breakout is above $0.015.

SUPRA finding its bottom begins with a healthy RRSUPRA RR is really nice. After a strong recovery, a rounded bottom would suggest a healthy accumulation range before we move up. Invalidation is clear while momentum and trend oscillators support a bullish move.
Full TA: Link in the BIO

SUPRA !! Big double bottom setupSupra has potential for double bottom. invalid level if it falls below 0.003591.
DYOR!NFA!
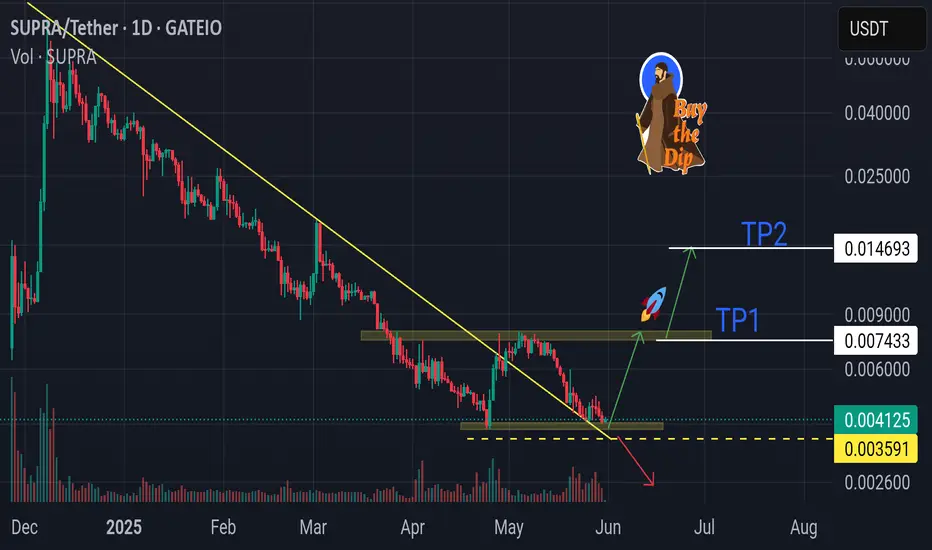
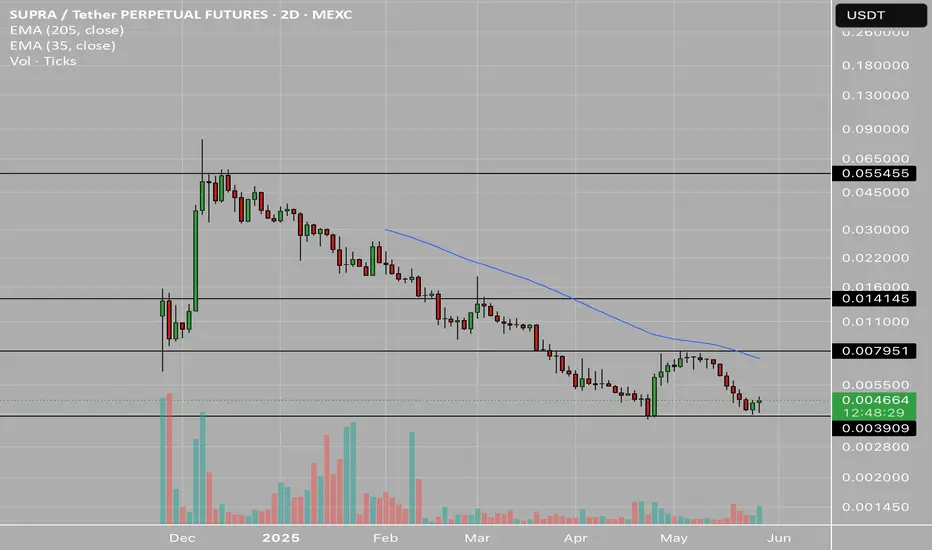
SUPRA Setting Up For Big Move UpThe 2 day chart on Supra looks as if it has bottomed. With some volume we could really see an explosive move to .014 in the short term.
$SUPRA Breakout Alert$SUPRA Breakout Alert
After months in a descending channel, SUPRA has broken out with strong volume.
Price flipped resistance into support and now targets the 0.01805 USDT level, a potential +174% move from the breakout point.
Eyes on 0.01805 📈 DYRO, NFA

$SUPRA Breakout Confirmed — Trend Reversal in Play!$SUPRA just flipped the script!
After months of bleeding under a brutal downtrend, it finally broke out clean and confident.
That long-term resistance? Crushed.
Now it's retesting the breakout zone, a classic reclaim move.
EMAs are curving up, momentum's clearly shifting.
In my opinion, this break

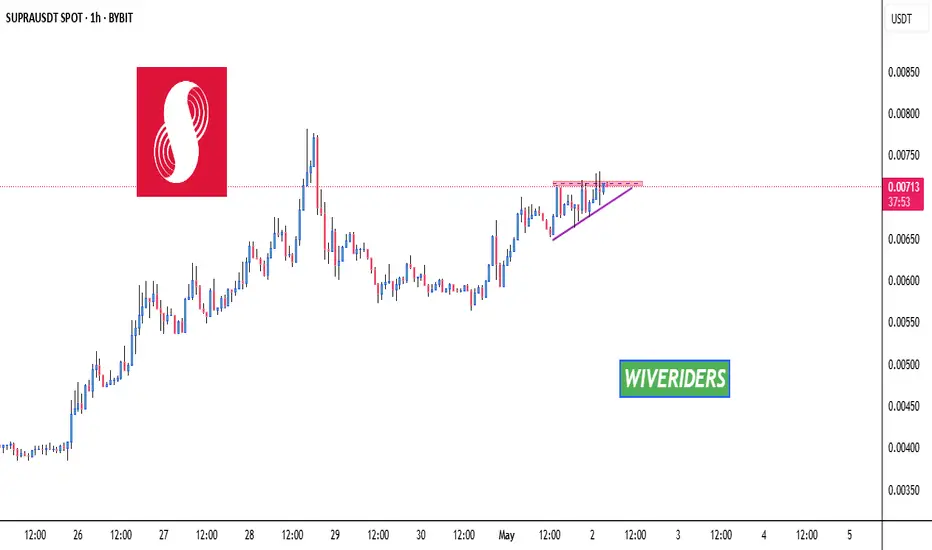
SUPRA is forming an ascending triangle patternSUPRA is forming an ascending triangle pattern and is approaching a key red resistance zone. A breakout above this level could confirm the bullish pattern and signal a strong upward move.
📈 Technical Overview:
Pattern: Ascending Triangle
Resistance Zone: Red area currently being tested.
🎯 Breakou
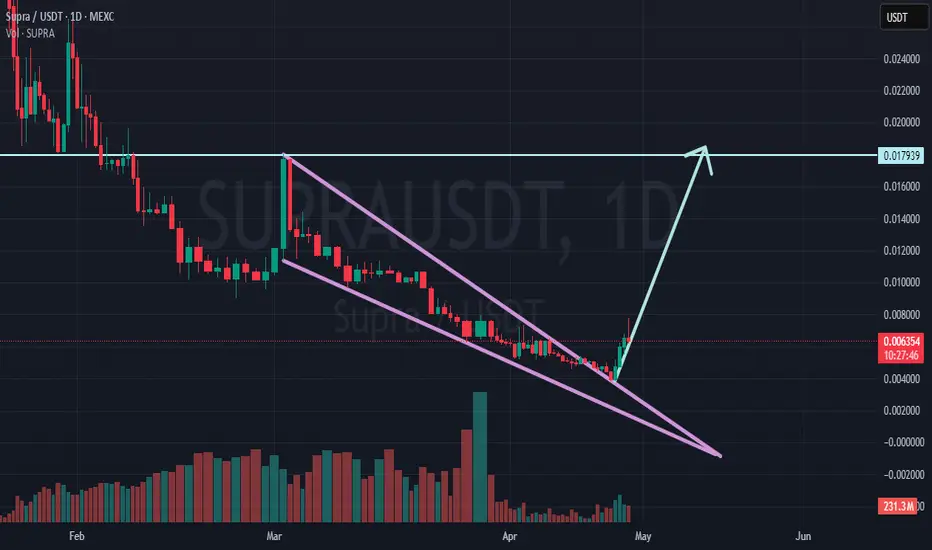
SUPRA: Classic Falling Wedge Breakout/Start of Bullish Uptrend The SUPRA/USDT daily chart highlights a textbook bullish reversal setup, marked by a well-defined falling wedge. Importantly, the extended downtrend within the wedge should not be seen as weakness — rather, it reflects a phase of strength through consolidation, as evidenced by the steady decline in
See all ideas
Summarizing what the indicators are suggesting.
Oscillators
Neutral
SellBuy
Strong sellStrong buy
Strong sellSellNeutralBuyStrong buy
Oscillators
Neutral
SellBuy
Strong sellStrong buy
Strong sellSellNeutralBuyStrong buy
Summary
Neutral
SellBuy
Strong sellStrong buy
Strong sellSellNeutralBuyStrong buy
Summary
Neutral
SellBuy
Strong sellStrong buy
Strong sellSellNeutralBuyStrong buy
Summary
Neutral
SellBuy
Strong sellStrong buy
Strong sellSellNeutralBuyStrong buy
Moving Averages
Neutral
SellBuy
Strong sellStrong buy
Strong sellSellNeutralBuyStrong buy
Moving Averages
Neutral
SellBuy
Strong sellStrong buy
Strong sellSellNeutralBuyStrong buy
Displays a symbol's price movements over previous years to identify recurring trends.
Frequently Asked Questions
The current price of SUPRAUSDT SPOT (SUPRA) is 0.004090 USDT — it has risen 5.85% in the past 24 hours. Try placing this info into the context by checking out what coins are also gaining and losing at the moment and seeing SUPRA price chart.
SUPRAUSDT SPOT price has fallen by −9.89% over the last week, its month performance shows a 47.14% increase, and as for the last year, SUPRAUSDT SPOT has increased by 36.33%. See more dynamics on SUPRA price chart.
Keep track of coins' changes with our Crypto Coins Heatmap.
Keep track of coins' changes with our Crypto Coins Heatmap.
SUPRAUSDT SPOT (SUPRA) reached its highest price on Dec 8, 2024 — it amounted to 0.080000 USDT. Find more insights on the SUPRA price chart.
See the list of crypto gainers and choose what best fits your strategy.
See the list of crypto gainers and choose what best fits your strategy.
SUPRAUSDT SPOT (SUPRA) reached the lowest price of 0.001920 USDT on Jul 6, 2025. View more SUPRAUSDT SPOT dynamics on the price chart.
See the list of crypto losers to find unexpected opportunities.
See the list of crypto losers to find unexpected opportunities.
The safest choice when buying SUPRA is to go to a well-known crypto exchange. Some of the popular names are Binance, Coinbase, Kraken. But you'll have to find a reliable broker and create an account first. You can trade SUPRA right from TradingView charts — just choose a broker and connect to your account.
SUPRAUSDT SPOT (SUPRA) is just as reliable as any other crypto asset — this corner of the world market is highly volatile. Today, for instance, SUPRAUSDT SPOT is estimated as 7.88% volatile. The only thing it means is that you must prepare and examine all available information before making a decision. And if you're not sure about SUPRAUSDT SPOT, you can find more inspiration in our curated watchlists.
You can discuss SUPRAUSDT SPOT (SUPRA) with other users in our public chats, Minds or in the comments to Ideas.