Sonic (FTM) coming into supportSonic made a new low like I was expecting after breaking key support.
We're coming into the first zone of support now, with targets extending quite deep if the bulls don't step in here.
Key stats
About S
Related coins
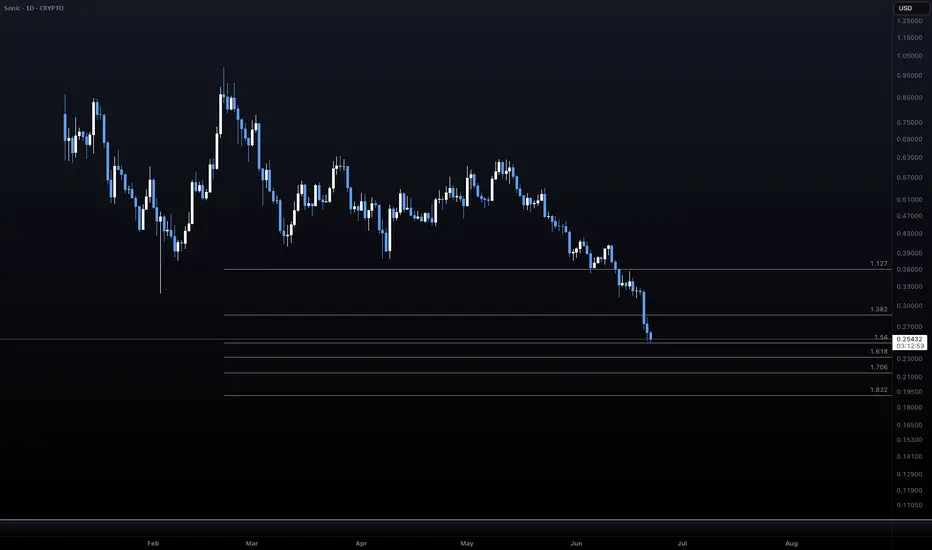
ABC correction into 5 wave EWTFrom Feburary high we've had our ABC correction and now in our 5 wave EWT. Wave 5 targets projected. i've used the green to show the micro 5 wave to get to my macro 5th wave.

FTM Delisting | OFICIALLY Becoming SONIC (S)Although a name change for FTM was announced in Aug 2024 already, many exchanges still list FTM, and this will soon change.
It is expected the Fantom will officially be delisted and become SONIC within the next two months.
In August 2024, Sonic Labs announced that they would be replacing Fantom

SUSD 4H Chart – Easy Trend with RSI Signal!SUSD on the 4H chart is in a steady uptrend within a channel since February. After a drop to the 0.285 level, it’s now at 0.382, sitting near the channel’s midline. RSI is at 54.26, showing neutral momentum—room to move either way. The yellow line suggests a potential push to the channel top at 1.00

S/USD to the Moon1. Indicators Present:
Ichimoku Cloud: Currently, the price is below the cloud, which generally indicates bearish conditions, but the cloud ahead seems thin, suggesting a potential breakout.
RSI (Relative Strength Index): The RSI is around 45.81, signaling neutral momentum but with a bullish diverg

Sonic (FTM) bullish corrective ideaLooking for a possible bullish correction to the .382 for continuation upwards in SONIC.
If we break below the 0.5 I wouldn't rule out a new low, although many levels of support inbetween.

Bullish Breakout for Sonic – Ideal Entry Levels to Watch!SET:SONIC (previously FTM) has broken above $0.733, confirming bullish momentum. However, a short-term pullback toward $0.645 - $0.618 could offer a better entry before the next move higher.
If support holds, the price may target $0.85 - $1.00, while a drop below $0.55 could weaken the bullish out

TVL PRICE MATCH $9
Hodl gang: this coin is strong as hell. Hold it you will get money either now or 3 years from now but then it will be gone more expensive than most top 50mc coins.

See all ideas
Summarizing what the indicators are suggesting.
Oscillators
Neutral
SellBuy
Strong sellStrong buy
Strong sellSellNeutralBuyStrong buy
Oscillators
Neutral
SellBuy
Strong sellStrong buy
Strong sellSellNeutralBuyStrong buy
Summary
Neutral
SellBuy
Strong sellStrong buy
Strong sellSellNeutralBuyStrong buy
Summary
Neutral
SellBuy
Strong sellStrong buy
Strong sellSellNeutralBuyStrong buy
Summary
Neutral
SellBuy
Strong sellStrong buy
Strong sellSellNeutralBuyStrong buy
Moving Averages
Neutral
SellBuy
Strong sellStrong buy
Strong sellSellNeutralBuyStrong buy
Moving Averages
Neutral
SellBuy
Strong sellStrong buy
Strong sellSellNeutralBuyStrong buy
Frequently Asked Questions
The current price of S (S) is 0.30650253 USD — it has fallen −0.68% in the past 24 hours. Try placing this info into the context by checking out what coins are also gaining and losing at the moment and seeing S price chart.
The current market capitalization of S (S) is 882.73 M USD. To see this number in a context check out our list of crypto coins ranked by their market caps or see crypto market cap charts.
S (S) trading volume in 24 hours is 107.43 M USD. See how often other coins are traded in this list.
S price has fallen by −20.64% over the last week, its month performance shows a 0.42% increase, and as for the last year, S has decreased by −57.61%. See more dynamics on S price chart.
Keep track of coins' changes with our Crypto Coins Heatmap.
Keep track of coins' changes with our Crypto Coins Heatmap.
S (S) reached its highest price on Jan 16, 2025 — it amounted to 1.99476340 USD. Find more insights on the S price chart.
See the list of crypto gainers and choose what best fits your strategy.
See the list of crypto gainers and choose what best fits your strategy.
S (S) reached the lowest price of 0.24960968 USD on Jun 21, 2025. View more S dynamics on the price chart.
See the list of crypto losers to find unexpected opportunities.
See the list of crypto losers to find unexpected opportunities.
The current circulating supply of S (S) is 3.22 B USD. To get a wider picture you can check out our list of coins with the highest circulating supply, as well as the ones with the lowest number of tokens in circulation.
The safest choice when buying S is to go to a well-known crypto exchange. Some of the popular names are Binance, Coinbase, Kraken. But you'll have to find a reliable broker and create an account first. You can trade S right from TradingView charts — just choose a broker and connect to your account.
S (S) is just as reliable as any other crypto asset — this corner of the world market is highly volatile. Today, for instance, S is estimated as 5.08% volatile. The only thing it means is that you must prepare and examine all available information before making a decision. And if you're not sure about S, you can find more inspiration in our curated watchlists.
You can discuss S (S) with other users in our public chats, Minds or in the comments to Ideas.