SUSDT - Bearish chart!Breaking down the rising wedge pattern in 4H chart
Price targeting the 0.45 level
Entry: 0.53 - 0.54
Targets: 0.525 - 0.515 - 0.505 - 0.480 - 0.450
Stoploss:0.570
Leverage: x5
Best regards Ceciliones 🎯
SUSDT.P trade ideas

SUI/USDT 1H: Bears Dominate, Discount Zone in Sight!SUI/USDT 1H Chart Analysis
🚀 Follow me on TradingView if you respect our charts 📈Daily charts!
Current Market Structure:
Bearish trend established with price breaking down to $3.30.
Hidden Bearish Divergence: RSI making higher highs while price makes lower highs, confirming bearish continuation.
Smart Money Activity:
Distribution phase visible at $3.75 resistance.
Market Makers accumulating liquidity near $3.20-$3.25 discount zone for further downside or potential future reversal.
Key Levels:
Entry Zone: $3.35-$3.40 (on relief bounce).
Targets:
T1: $3.20 (discount zone).
T2: $3.00 (psychological support).
Stop Loss: Above $3.55 (recent swing high).
Risk Score:
7/10 (favorable R:R but high volatility).
Market Maker Intent:
Accumulation in progress below $3.25, targeting deeper liquidity near $3.00.
Volume profile supports further downside unless key resistance at $3.75 is reclaimed.
Recommendation:
Short positions are favorable within the $3.35-$3.40 range.
Maintain tight stops above $3.55 to manage risk.
Monitor price action near $3.20 for potential support confirmation.
Confidence Level:
8/10 for bearish continuation.
🚀 Follow me on TradingView if you respect our charts 📈Daily charts!

SUSDT: trend in 2H time frames The color levels are very accurate levels of support and resistance in different time frames, and we have to wait for their reaction in these areas.
So, Please pay special attention to the very accurate trend, colored levels, and you must know that SETUP is very sensitive.
Be careful
BEST
MT

(Prev. FTM) Support and Resistance Zone: 0.4126-0.4930
Hello, traders.
If you "Follow", you can always get new information quickly.
Please click "Boost".
Have a nice day today.
-------------------------------------
(SUSDT 1D Chart)
FTM Coin (Token) has been changed to Sonic Coin (Token).
Since the chart was newly created on January 16, the support and resistance role may be weak, so be careful when trading.
-
(12h chart)
Since the indicator has not been created yet on the 1D chart, support and resistance points are not displayed, so the 12h chart was used.
The point of interest is whether it can rise above the Fibonacci ratio of 0.236 (0.5815) ~ 0 (0.6565).
To do so, it is important to see whether it can receive support near the BW (0) indicator point of 0.4126 and rise above 0.4930.
If it falls below 0.4126, it is likely to fall to around the Fibonacci ratio of 1 (0.3385).
Therefore, if it shows support in the low boundary zone of 0.4126-0.4930, it is a time to buy.
-
The MS-Signal indicator is an indicator that can tell the trend.
Therefore, if the price stays above the MS-Signal indicator, there is a high possibility that it will turn into an uptrend.
-
Thank you for reading to the end.
I hope you have a successful trade.
--------------------------------------------------
- Big picture
I used TradingView's INDEX chart to check the entire range of BTC.
(BTCUSD 12M chart)
Looking at the big picture, it seems that it has been maintaining an uptrend following a pattern since 2015.
In other words, it is a pattern that maintains a 3-year uptrend and faces a 1-year downtrend.
Accordingly, the uptrend is expected to continue until 2025.
-
(LOG chart)
Looking at the LOG chart, you can see that the uptrend is decreasing.
Accordingly, the 46K-48K range is expected to be a very important support and resistance range from a long-term perspective.
Therefore, it is expected that prices below 44K-48K will not be seen in the future.
-
The Fibonacci ratio on the left is the Fibonacci ratio of the uptrend that started in 2015.
In other words, it is the Fibonacci ratio of the first wave of the uptrend.
The Fibonacci ratio on the right is the Fibonacci ratio of the uptrend that started in 2019.
Therefore, it is expected that this Fibonacci ratio will be used until 2026.
-
No matter what anyone says, the chart has already been created and is already moving.
It is up to you how to view and respond to this.
If the ATH is renewed, there are no support and resistance points, so the Fibonacci ratio can be appropriately utilized.
However, although the Fibonacci ratio is useful for chart analysis, it is ambiguous to use it as support and resistance.
The reason is that the user must directly select the important selection points required to generate Fibonacci.
Therefore, since it is expressed differently depending on how the user specifies the selection points, it can be useful for chart analysis, but it can be seen as ambiguous to use it for trading strategies.
1st: 44234.54
2nd: 61383.23
3rd: 89126.41
101875.70-106275.10 (when overshooting)
4th: 134018.28
151166.97-157451.83 (when overshooting)
5th: 178910.15
-----------------

sonic was awful ........ Decision ZoneIt was awful ........ Decision Zone
Will the price increase go to the liquidity box?

S / USDT Chart Analysis S Sonic (prev. FTM) Showing bullish on 4 hours chart
Holding well above $0.50 key support level.
Short Term Target : $0.66 - $1
@Whalesdesk


S (previous FTM)Must hit its ATH against the Bitcoin conditions!
10$ is minimum price for this L1 Blockchain

Short-term signalsShort-term signals
Sonic will go one step higher
Everything is ready to build the floor that was created on the chart and the ceiling is marked

Sonic's harassment continuesSonic's troubles continue
Sonic and the market will soon have at least a 5% correction

S is sexy moreOnly a shitcoin act just like this move toward Down! Even most of those shitcoins didnt move downward like S!!!
After conversion to S ,must move to upside...this chart only proves that S has nothing within it

Sonic - time to pay attention - longMarket is bleeding but Sonic gain some momentum after bottoming out?!
Sonic total value locked explodes, and I think the price soon should follow. Big money are likely positioning for Sonic airdrop. I think it's logic that we see Sonic grow from here a few weeks ahead
Daily close above 0,517 and Sonic looks strong to go long again!

S is not strength enough to investS is acting as a shitcoin,I dont know why the creators are not eager to support the projects chart?
Even shitcoins act very better than S on chart!

SUSDTSONIC path prediction : Its possible that SONIC will complete this scenario
(Based on FTMUSDT chart)

$S Coin on 4hour chartI expect this move soon as its start showing positive signals this not a financial advice but keep it in the favorite because you will come back later for this post 🤝

SUSDT - a pattern as text bookS looks bullish as it breakout the trendline in 4h chart
consolidation a v bottom pattern as text book... price acton expected to be a shown in chart
(breakout the neckline , retest then continuation in bullish)..
expected 25% bullish rally in coming days
Best regards Ceciliones🎯

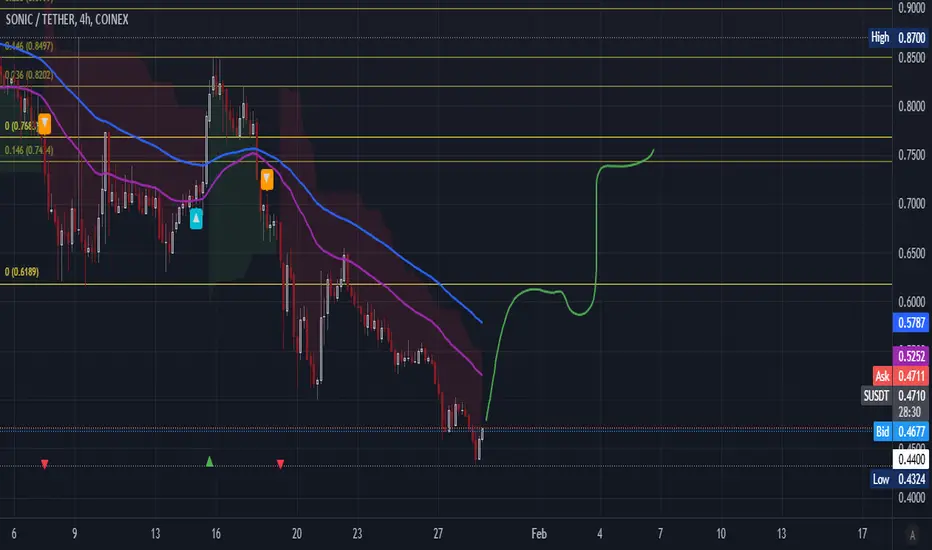
S 01/29/2025@Sonic has been abandoned by the market, market maker and team in terms of pricing and therefore has acted completely bearish, even in the positive parts of the market and the positive signals issued by the indicators, #Sonic still failed to grow and falls with the slightest event.
According to the Sonic team's opinion and conclusion to support the price, this trend will change soon and I think we will see the price increase according to the green line.
#S #FTM #FANTOM
Sonic Sonic represents a next-generation blockchain platform designed to revolutionize the developer experience through unprecedented speed, security, and incentive structures.
The platform introduces innovative features including Fee Monetization, offering developers up to 90% of transaction fees, while maintaining superior transaction processing capabilities compared to current industry standards.
Its architecture combines robust security measures with developer-centric design, creating a sustainable ecosystem for decentralized application development.

What Can Be Happen With Fantom (FTM After Being Sonic (S)İn August 2024 FTM decided to transform Sonic with some increase in speed etc. Finally with the 2025 beginning, we can see Sonic (S) in coin markets, but with bad performance.
After the last H of FTM-nearly 1.41 Dollar ,it was continiously decreased. And now 0.63 . Maybe this losing will go on till 0.50-0.55 levels. But after then new S -Sonic. need to go up to first resistance 1.4 Dollar first, then old ATH 3.4xx Dollar which İt has done in 2021-2022 years.
As a Project FTM-To-Sonic has its echo system environment, and a strong base. At the end Sonic (S) will reach the value İt deserved. But we hope not will be so long.It will be fast.

Quick updateSonic Update: The drop I predicted in FTM happened exactly and now the indicator has signaled an increase, I hope it will soon compensate for these drops due to migration and return above $1. My targets for FTM and Sonic are very high,
the first target is $7, $20 and $70 according to previous analysis in my account
FARSI:
rizeshi keh dar fantom pish bini kardam daghighan etefagh oftad va alan andikator soud ra signal kardeh ast, omidavaram zudtar in rizesh ro jabran koneh bekhater mohajerat va bargardad balaye 1 dolar. targat man baraye fantom va sonik besiar balast, targat 7 dolar va 20 dolar va 70 dolar ast tebgh tahlil ghabli dar akantam

Reversal for Sonic has commencedSeems like 50 cents has some iron wall defending it and now double bottom at 50 cents was established, allowing those who wanted to exit to do so (capitulation), based on the volume.
We now have made a clean reversal on the hourly.
Next targets are the launch high, which is a nice take profit target to those on long positions, but i expect overall trajectory to be higher.

SUSDTRisk warning, disclaimer: the above is a personal market judgment based on published information and historical chart data on Tradingview, all analysis is only subjective. Hope investors consider, that I am not responsible for your investment decision.
Thank you.
Good luck
