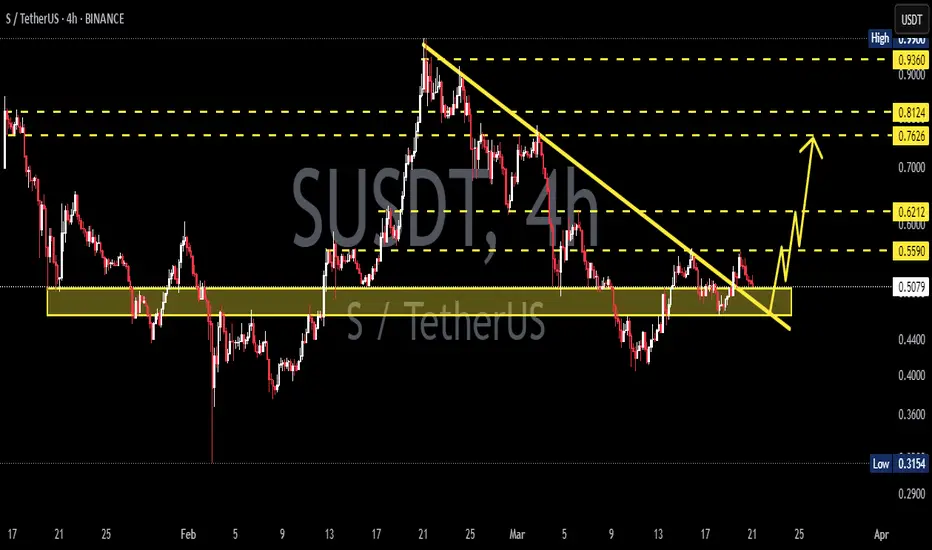
Long SONICS broke through the resistance level and the descending trendline. Bullish movement to $0.86 is expected to happen
SUSDT.P trade ideas

S (Sonic) Double BottomThe latter low tops the one before,
RSI climbs steady, step by step in store.
MACD converges, bullish and bright,
Volume surges, buying takes flight.
The chart unveils a hopeful gleam,
Price ascends, breaking the dark’s regime.

SUSDT 4HS ~ 4H Analysis
#S Buy from here if you only have a Conviction on this coin with a short -term target of at least 10%+.
Current Sonic RangeSome fib extensions and a fib retracement to plot out current range of Sonic (prev. FTM).
I believe this will be the next big L1 in crypto, have been buying below .50 and in the lower retracement levels.

Sonic/USDT This coin is one of the most promising coins i know. (this is not financial advice)
At the pov we see it now is it crazy that this is even possible, why?
FTM made a switch to SU last year, with a this big community it is not possible to fail.
Its not looking good Im glad i got out of this coin, Pump and dump. Still got a tiny bag but its not looking good at all.
Dumped again from last support (now resistance) while btc is just steady.
Team is constantly posting about how big they growing and how much TVL they gaining but price is only decreasing and team is dumping on investers

SPOT S LONG 14.03.2025Pinning after abnormal purchases.
💰I enter at the market price.
I'll let you know when I record it manually.
‼️Risk per trade: 1% of the allocated funds for spot trading.
Thank you!

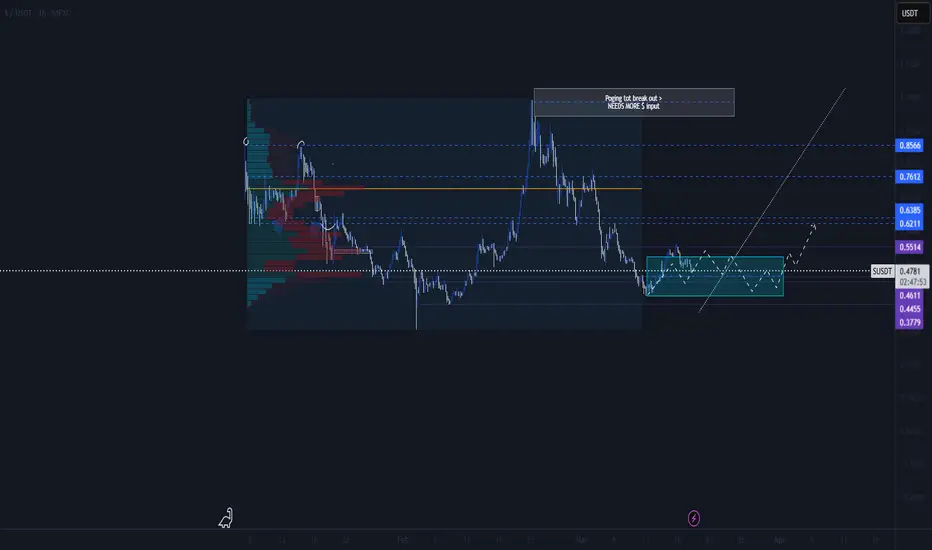
SU/USDT REVIEWSU/USDT Market Review – Potential Breakout Opportunity
After the previous fake breakout around $0.99, it became evident that there wasn’t enough liquidity in the market to sustain a breakout of that magnitude. This aligns with the broader macroeconomic landscape, where U.S. money printers have yet to fully engage, limiting the influx of fresh capital into assets like crypto.
Now, we are witnessing the formation of a new breakout structure, presenting an attractive buying opportunity at a discounted price level. Historical price action suggests that similar setups have preceded significant upward movements. Given the current market conditions and the cyclical nature of liquidity flows, this could be an optimal entry point before the next leg up.
Traders should keep an eye on volume expansion and market sentiment to confirm the strength of this potential breakout. If liquidity injections increase, we could see a strong rally, potentially breaking previous resistance levels and entering a new price discovery phase.
Key Levels to Watch:
Support: Current price zone as a potential accumulation area
Resistance: Breakout level near previous highs (~$0.99 and beyond)
Liquidity influx: A key factor for sustained momentum
As always, risk management is essential—while the setup looks promising, market conditions can shift rapidly.

UpdateSonic has been terrible, even though its TVL has been excellent and it has achieved high rankings and is in the top ten, the price is not attractive at all. I hope the market maker will take control and the climb will begin.
A little more fall, a little more suffering and a price rise

Bulls in Trouble! Sonic Rejected Again—Lower Lows Incoming?Yello, Paradisers! Is #Sonic about to take another dive? The latest price action suggests trouble for the bulls. After failing to reclaim key support, the downtrend is back in full force.
💎#SUSDT continues to reject from a historically strong resistance at $0.63 – $0.65, a level that has repeatedly proven difficult to break. This latest rejection is only accelerating the downside, putting lower targets into play.
💎The sellers are initially aiming for the $0.46 – $0.44 levels, a strong support zone where we could see some short-covering as traders take profits on their positions. This level has provided temporary relief in the past, making it a key area to watch.
💎However, if sellers maintain control and the bearish momentum continues, the price could dip even further into the $0.3850 – $0.3740 zone. This area has historically acted as a strong support base, attracting significant buying pressure that could fuel a potential reversal.
💎For bulls to regain control, they must reclaim the $0.63 – $0.65 zone, a strong resistance level. However, with descending resistance reinforcing this area, breaking out won’t be easy. Until then, the trend remains bearish, and lower levels are in play.
Stay patient, Paradisers! The market always rewards discipline. If we see confirmation, we take action. If not, we wait. Trade smart, not fast! 🎖
MyCryptoParadise
iFeel the success 🌴

$S Sonic movementHow I see NYSE:S Sonic moving. It looks like it will bounce off the level of volume drawn and make a move higher.
Really depends if it accumulates liquidity around the purple zone drawn out.

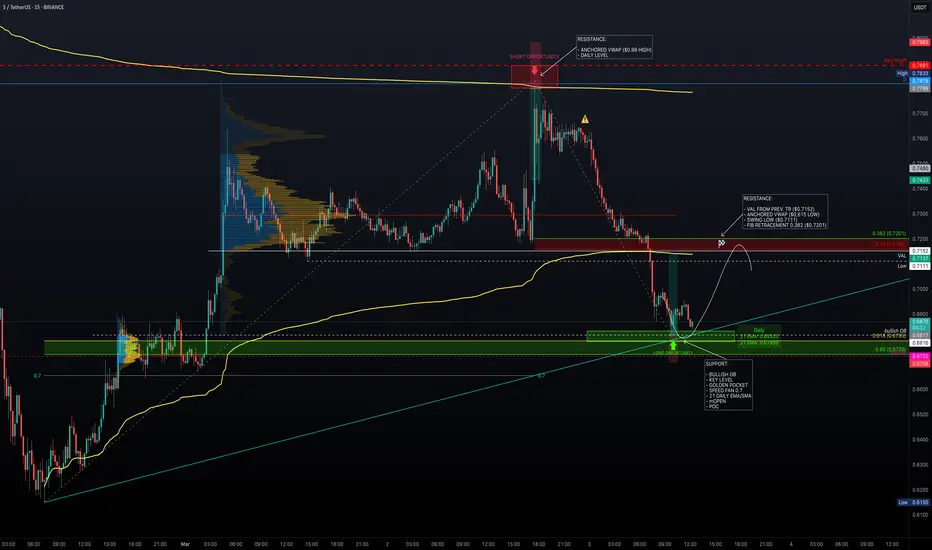
Major Levels – Is Sonic Ready to Pump?After reaching the daily resistance level ($0.7818), price faced strong rejection. The anchored VWAP, acting as dynamic resistance just below the daily level, provided additional confluence for a low-risk short opportunity.
Additionally, a key high at $0.7891 further reinforced this resistance zone. Following the rejection, price sharply declined -13%, retracing back into the previous trading range.
Support Confluence
Price is now approaching a well-defined support zone:
Bullish Order Block: $0.6816
Key Level Near Order Block: $0.6803
Golden Pocket (Fib 0.618 - 0.65): 0.618 at $0.6793 & 0.65 at $0.6739
Monthly Open: $0.6732
Point of Control (POC): $0.6732 (aligning with Monthly Open)
Daily 21 EMA/SMA: 21 EMA at $0.6835 & 21 SMA at $0.6790
Fib Speed Fan 0.7 (from $0.615 to $0.7818): Providing additional support in this zone
Long Trade Setup
Entry Zone: $0.6816 – $0.6732
Stop Loss: Below the Monthly Open ($0.6732)
Take Profit Zone: $0.7111 – $0.7201
Risk-to-Reward (R:R): 3:1 R:R setup, offering a high-probability trade
Take Profit Targets & Resistance Zones
Previous Swing Low: $0.7111 (untested)
Value Area Low (VAL): $0.7152
Anchored VWAP (from $0.615 low): $0.7137
Fib Retracement 0.382 (from $0.7818 high to current low): $0.7201
SUSDT BULISHThe market has been in a bad situation following the Bybit stolen coins incident. However, I can see that SUSDT may turn bullish now.
Please pay close attention to the danger zone and stop loss.
Note: My ideas are not intended for any type of scalping or scalpers!
You can find the full list of my ideas here: www.tradingview.com
Here are some of my ideas:

$SUSDT | Limit Long #4H📌 Current Situation:
A deviation of the key level occurred, followed by a strong recovery and consolidation on the 1H timeframe.
The price rebounded from a critical zone, showing a local reversal.
🎯 Trading Plan:
🔹 Entry Zone: Limit orders in the range of 0.6828 - 0.6670 (1H OB cluster).
🔹 Stop-Loss: Placed below 0.6524, as marked on the chart.
🔹 Target: Potential upside towards 0.88 - 0.90 as part of a mid-term recovery.
📈 Justification:
✅ Technical Support: The price bounced off a strong demand zone.
✅ Market Structure: Possible formation of an Inverse Head and Shoulders pattern.
✅ Risk/Reward: Favorable R/R ratio, with strong support below current levels.
💡 Conclusion:
The trade setup is justified in terms of risk management and market structure. However, it's crucial to consider BTC's overall trend, as it impacts the entire altcoin market.

SONIC update#S or the former #FTM made a big correction after its huge rising its better to use this oppurtunity to buy more of it this coin has good funda too

Retest complete, now send!Its perfectly tested the breakout point. Lets hope it will reverse here!
If btc behaves we should see 1$ fast


Sonic (prev. FTM) - A new era for this Coin!
Who remember this coin coin? A Layer 1 which has made the history and the first part of the crypto ERA..
Sonic is now the highest-performing EVM L1, combining speed, incentives, and world-class infrastructure, powering the next generation of DeFi applications. The chain provides 10,000 TPS and sub-second finality.
WOW , what a rebrand and upgrades!
We can also see from a chart point of view that the price, after forming a head&shoulders pattern, now is breaking up the 0.64$ level leaving no room for doubts.
The upgrade is make people to inflow money to the project, and volumes is sustaining the price's growth.
As we speak the price is leading towards 0.83$ price where we have our first potential possible target, the we see our second target around 1.4$ if volumes and the structure will remain strong!
good trading

Sonic to the moon?No analysis, more just a noting of where the key support and resistance areas are.

SONIC $S $0.50 long updateBuyers need to show up fast, or Sonic is sliding straight into the next liquidity zone. While the bands are tightening and price is hovering below them, momentum is fading. Stoch and Stoch RSI suggest a short-term bounce is possible, but RSI dipping below 50 signals weakening strength.
Bulls either step in here, or this breaks down further and I'm eager to add more. Sonic NYSE:S will be good to our wallets :)

SUSDTWe can attempt to buy SUSDT from specified level as it make HL , also there is no bearish divergence occur indicate that it moves upward.
SL , TP mention in chart.

S Update ( sonic ) I believe Sonic is in a strong position, and we might consider buying in gradually. The most important support level we have is the defined range of $0.65 to $0.57 . If the price reaches this area, I will be looking to make significant purchases.

UpdateCan Sonic maintain this support and be launched from the orange box? If not, lower supports should be considered.
