Sonic Token Tests Critical Support at Point of Control Sonic Token (S) is holding a major confluence support zone that could act as the foundation for a bullish reversal. A strong bounce here may lead to a retest of the $0.42 swing high.
Sonic Token (S) has corrected into a significant support region, aligning with both the Point of Control (POC) and t
Related pairs
SONIC. USDTIt's been a long time the current Sonic( S ), and the Fantom of the past have been moving in neutral.
So,
It's time to make a profit for their investors.

$SUSDT (or S , ex FANTOM): good entry for a long setupCrypto Market Outlook
The overall crypto market is in a clear uptrend.
The money printer is running, and USD dominance is dropping — all signs pointing to a potential continuation of the rally in the coming months.
Unless a black swan event hits, it's not too late to position yourself if you’re s

S - SONIC 1DSonic lacks the buying volume to break through its resistances.
The project, after a name change, has become Matic 2.
I expect that we'll soon reach support levels of 30 cents and 25 cents after the pullback is complete. If these supports are broken, the next support levels will be 20 cents and 17

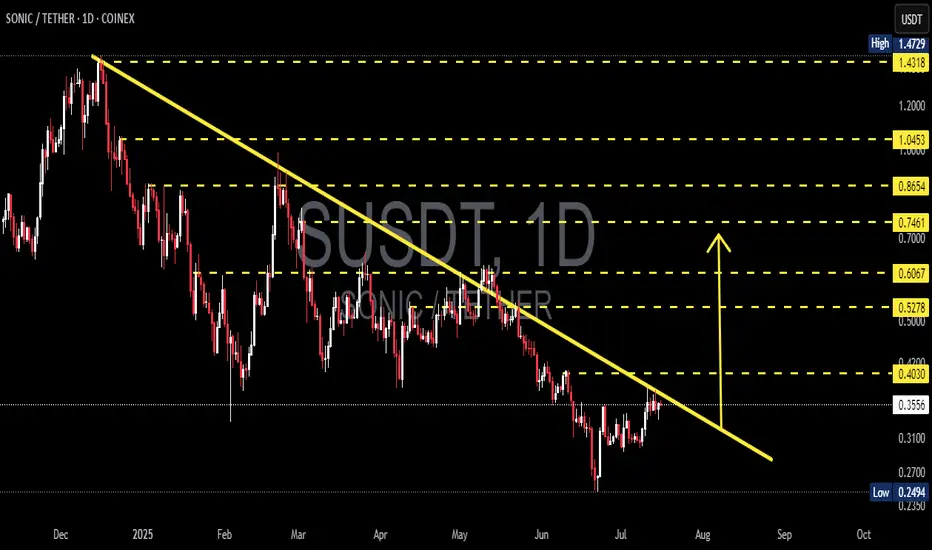
SONIC/USDT Breakout in Progress? Watch This Critical Level Close🧠 Technical Breakdown – Daily Chart (1D, Coinex)
The SONIC/USDT pair is currently exhibiting a textbook descending trendline breakout setup, formed over the past 7+ months. This long-term downtrend has been respected since late November 2024, connecting multiple lower highs and establishing a well-
Sonic Moves Next · Expect Massive Growth Coming Weeks —300% EasyTwo pairs-projects will be moving strongly in the coming weeks, Sonic and Usual. This is the chart for SUSDT (Sonic) on the daily timeframe.
Notice how the action is moving back above the 3-February 2025 low (bullish). Notice the stop-loss hunt event recently. This events marks a bottom once it hap

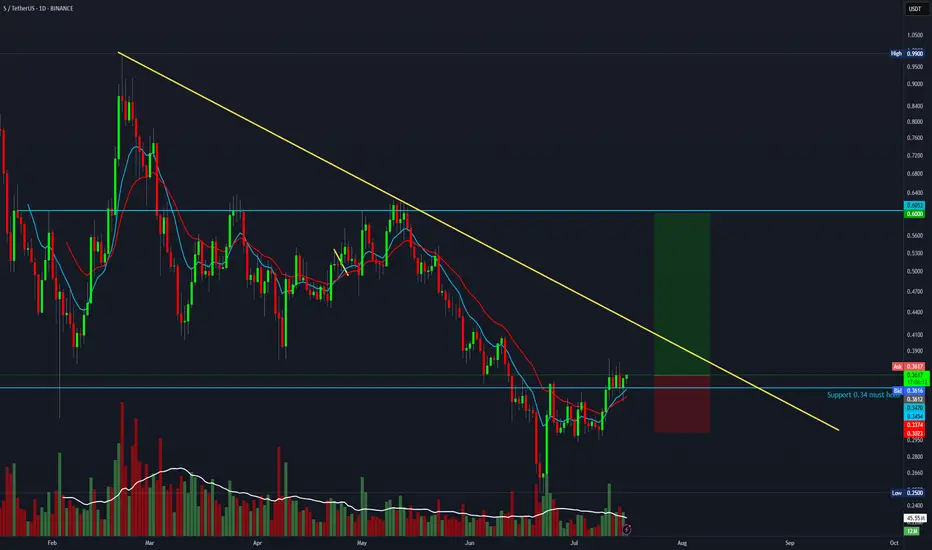
Trade setup with a 4:1 R:R for S (formerly FTM)BTC is likely about to continue its move toward 135K — if you're a bull, this is a solid setup with a 4:1 R:R.
Entry: 0.36
Stop Loss: 0.30
Target: 0.60
S (Sonic Network) Bullish daily hammer candle closed above a key daily swing high.
So much liquidity to take above.
Send it.
25-28% daily candle loading

Sonic ($S) Price Analysis: Key Levels to WatchThe markings on your chart outline a trading plan based on key price levels:
Resistance (Potential Sell Zones): The red lines at approximately $0.3520 and $0.3660 are acting as price ceilings. For the price to go up, it needs to break through these levels.
Support (Potential Buy Zones): The green

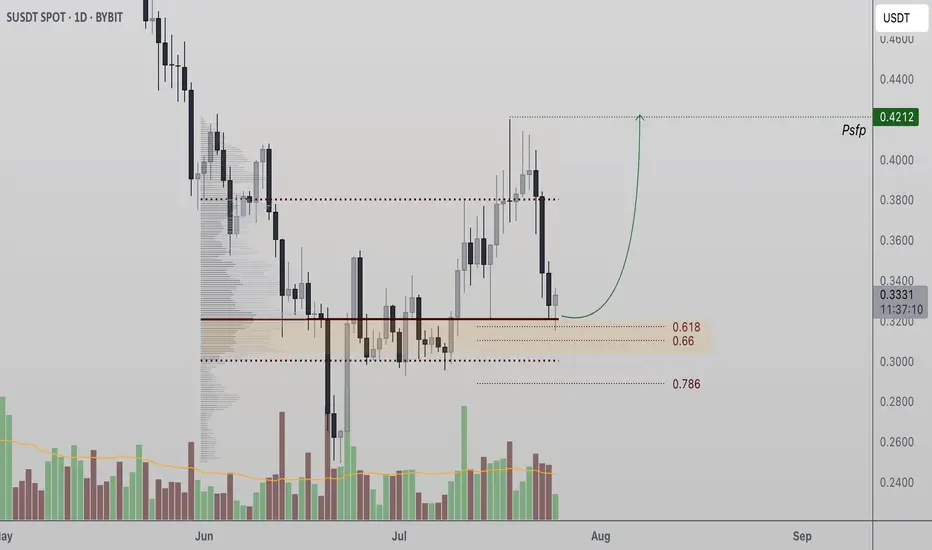
Sonic pull back - opportunity comingSonic - are we going for a deep pullback?!
If so...
We have confluence for a bonce - MA 200 (4h), Fib 0.618, Diagonal trendline.
I think Sonic cold respond nicely in the area 0.324-0.332 and after that move on for higher target (0.4).

See all ideas
Summarizing what the indicators are suggesting.
Oscillators
Neutral
SellBuy
Strong sellStrong buy
Strong sellSellNeutralBuyStrong buy
Oscillators
Neutral
SellBuy
Strong sellStrong buy
Strong sellSellNeutralBuyStrong buy
Summary
Neutral
SellBuy
Strong sellStrong buy
Strong sellSellNeutralBuyStrong buy
Summary
Neutral
SellBuy
Strong sellStrong buy
Strong sellSellNeutralBuyStrong buy
Summary
Neutral
SellBuy
Strong sellStrong buy
Strong sellSellNeutralBuyStrong buy
Moving Averages
Neutral
SellBuy
Strong sellStrong buy
Strong sellSellNeutralBuyStrong buy
Moving Averages
Neutral
SellBuy
Strong sellStrong buy
Strong sellSellNeutralBuyStrong buy
Frequently Asked Questions
The current price of S / USDT Spot Trading Pair (S) is 0.3353 USDT — it has risen 0.42% in the past 24 hours. Try placing this info into the context by checking out what coins are also gaining and losing at the moment and seeing S price chart.
S / USDT Spot Trading Pair price has fallen by −11.39% over the last week, its month performance shows a 7.72% increase, and as for the last year, S / USDT Spot Trading Pair has decreased by −58.90%. See more dynamics on S price chart.
Keep track of coins' changes with our Crypto Coins Heatmap.
Keep track of coins' changes with our Crypto Coins Heatmap.
S / USDT Spot Trading Pair (S) reached its highest price on Feb 21, 2025 — it amounted to 0.9879 USDT. Find more insights on the S price chart.
See the list of crypto gainers and choose what best fits your strategy.
See the list of crypto gainers and choose what best fits your strategy.
S / USDT Spot Trading Pair (S) reached the lowest price of 0.2496 USDT on Jun 22, 2025. View more S / USDT Spot Trading Pair dynamics on the price chart.
See the list of crypto losers to find unexpected opportunities.
See the list of crypto losers to find unexpected opportunities.
The safest choice when buying S is to go to a well-known crypto exchange. Some of the popular names are Binance, Coinbase, Kraken. But you'll have to find a reliable broker and create an account first. You can trade S right from TradingView charts — just choose a broker and connect to your account.
S / USDT Spot Trading Pair (S) is just as reliable as any other crypto asset — this corner of the world market is highly volatile. Today, for instance, S / USDT Spot Trading Pair is estimated as 4.39% volatile. The only thing it means is that you must prepare and examine all available information before making a decision. And if you're not sure about S / USDT Spot Trading Pair, you can find more inspiration in our curated watchlists.
You can discuss S / USDT Spot Trading Pair (S) with other users in our public chats, Minds or in the comments to Ideas.