SONIC or S and formerly FANTOMSonic (formerly Fantom), Ethereum’s Layer 1 virtual machine cryptocurrency, has made two attempts to break through $0.62 and reach its previous price of $1 after price corrections, but failed each time.
If it follows the pattern, it could reach its previous price of $1 and even higher this time.
SUSDT trade ideas

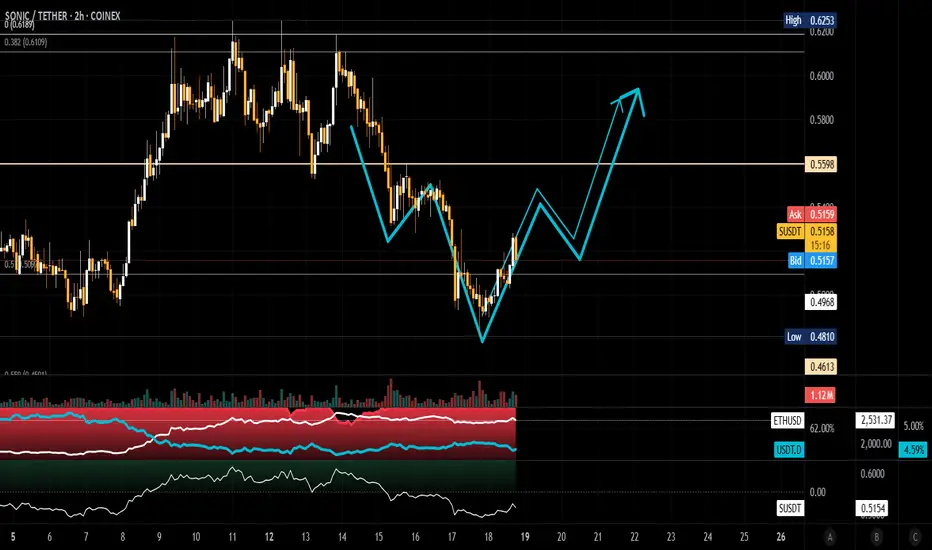
Sonic Reversal Play with a High R/R SetupPrice has dropped right back into the same demand zone that held everything together during the last major flush. I noticed we’re getting clear RSI divergence thus price is bleeding lower, but momentum isn’t following. That usually means to me that sellers are getting tired.
There’s also a large gap in the chart above it’s current base. If we reclaim even the low $0.40s, there’s room to rip to the upside. The liquidity supports the thesis of a 200%+ move straight into that inefficiency zone sitting just under $1.10.
Why this matters:
• RSI isn’t confirming the breakdown
• Strong historical support is holding (green box)
• That gap above hasn’t been revisited—yet
• The crowd is convinced it’s dead, which is usually when it wakes up
My levels:
• Entry: Here, while it’s still bleeding
• TP1: $0.50
• TP2: $0.90
• TP3: $1.10
• SL: Tight, just under $0.32
I’m not calling a moonshot. I’m just saying this chart is screaming for attention, and the reward looks too clean to ignore.

$S | 4h - 12hNo trade here. Sweep zone, waiting for a clean bounce or SFP to enter — otherwise, skip.
No confirmation = no move.
First target $0.57–0.63 if bulls wake up.
Break below $0.42 — time for new lows.
No chasing.

SONIC Impulse Structure Emerging Wave 2 in ProgressSONIC has confirmed the end of its prior bearish cycle after completing a complex corrective structure, culminating in a breakout from a bullish falling wedge formation. The movement marks the initiation of a fresh impulsive sequence, with Wave 1 delivering a solid leg to the upside.
We can deduct from the current price action the start of a Wave 2 correction, unfolding towards the highlighted Buy Back Zone, which coincides with a key structural support range. This zone presents a potential low-risk re-entry opportunity ahead of Wave 3 development.

Sonic towards 0.46 target personal idea: Sonic reached its previous lower bottom and we see trying to bounce off here, In my opinion the first target is 0.46 and breakout of this zone probably will move to it's previous high high around , 0.9-1 price. Good 🙂 luck 👍

S (Ex FTM) UpdateS is Preparing for a Key Liquidity Grab and Potential Reversal
Previously, S swept the liquidity from the upside and formed a zig-zag corrective structure within a descending channel. Following a clean breakdown, it has struggled to recover — despite broader bullish conditions in the market.
Now, the structure is showing strong signs of a potential long-side liquidity grab in the coming days or weeks. This setup often marks the final phase of accumulation before a major upside move.
Additionally, the price action aligns perfectly with Fibonacci extension levels, particularly around the $0.38 zone, which could act as a key support and entry area for long positions.
A decisive reaction from this zone could trigger the beginning of a strong reversal, leading to the next impulsive leg.
— Thanks for reading.

SUSDT - 1WThe previous bullish analysis failed and I currently expect a correction to the range of 0.3 to 0.33 cents...

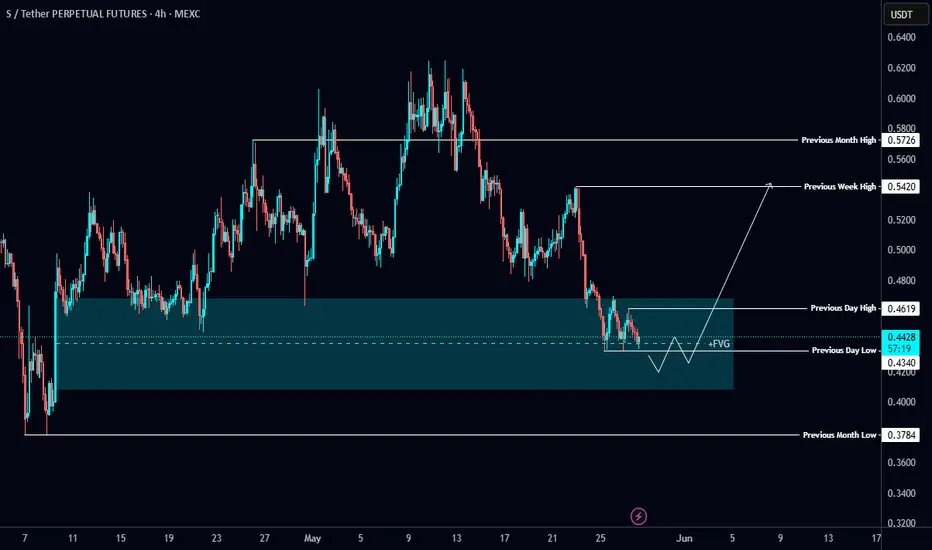
$S/USDT Setup Loading📊 $S/USDT Setup Loading 📊
📉 Equal Lows building near PDL — liquidity stacking up 👀
Looking for a sweep into the 4H FVG zone to trigger a long entry 🎯
Gotta see confirmation first — no blind entries here 🔒
Patience = precision
S/USDT Potential UpsidesHey Traders, in today's trading session we are monitoring S/USDT for a buying opportunity around 0.4300 zone, S/USDT is trading in an uptrend and currently is in a correction phase in which it is approaching the trend at 0.4300 support and resistance area.
Trade safe, Joe.

$SONIC Spot Holding Setup:The price is currently hovering near the bottom of the parallel channel, a key area that has historically provided strong support.
* Perfect zone for spot accumulation
* Risk-reward is highly favorable from this level
* Previous bounces from this zone have shown significant upside
If the channel holds, we could expect another leg up toward the mid or upper range. Ideal for long-term holders looking to position early without high leverage exposure.
Accumulate slowly near current levels and manage downside with a soft stop in case of breakdown. Patience will pay.

SUSDT🔹 Market Structure Overview:
Ascending Trendline Support:
Price continues to respect an ascending support trendline (white and blue), creating a series of higher lows — a bullish structural sign. This trendline has acted as a launchpad multiple times and currently supports price around $0.46.
Break of Structure (BOS):
A bullish BOS has occurred above local highs, indicating smart money interest and a potential shift in market direction. This BOS is a critical reference for validating bullish continuation.
Key Demand Zone:
The $0.38 area (green line and orange box) is a strong demand level, previously used as a reaction point. This level aligns with trendline confluence and will be crucial for maintaining upward momentum.
Liquidity Events:
Multiple liquidity sweeps (highlighted with orange circles) show classic signs of stop hunts below previous lows and highs — behavior often linked with institutional accumulation.
🔸 Upside Targets:
Target 1: $0.88 – $1.05
A well-defined supply zone from previous distribution, likely to act as a magnet if bullish pressure continues.
Target 2: $2.80 – $3.40
A larger macro imbalance zone, likely to be targeted in a stronger trend expansion phase. This would require sustained bullish structure and volume.
🧠 Conclusion:
The chart presents a well-structured bullish scenario underpinned by SMC principles. As long as the trendline and $0.38 demand zone hold, bulls are in control. A confirmed breakout above $0.60 would open the path to higher targets, while a break below $0.38 would invalidate the setup and shift the bias bearish.

SUSDTAfter forming a Diametric pattern and then correcting after that, the price is now ready to move to the specified range...

Susdt Based on the weekly trendline I’ve drawn, the area around 0.4360 looks like a very attractive buy zone. The first target is the channel’s midpoint, and the second target is the channel top, which should be reached soon.

SONIC (FTM) WEEKLYCurrently forming a base for a move toward ATH.If ATH is broken, mid-term and long-term targets are set.
This is just my personal opinion and should not be used as a basis for trading

Long Trade set-up SUSDT:SonicUSDT: A clean bounce from the lower trendline of the ascending channel is showing strength! 📈
We’re seeing price reclaim the EMA support with strong structure holding.
🎯 Targets ahead:
• TP1: $0.6298
• TP2: $0.8147
🔒 SL below: $0.4718
Risk-managed and technically sound setup.
✅ Keep this one on your radar — or jump in if price retests near entry!

TradeCityPro | S: Trendline Break Signals Key Support Retest👋 Welcome to TradeCity Pro!
In this analysis, I’m going to review the S coin—one of the Layer 1 coins for the Sonic network.
💥 This coin currently holds a market cap of $1.43 billion and ranks 58th on CoinMarketCap.
⏳ 1-Hour Timeframe
On the 4-hour chart, as you can see, there’s a large range box between the 0.3939 and 0.6147 levels where price has been moving sideways.
🔍 A key support zone also exists between 0.45 and 0.46, which has received strong bullish reactions, pushing the price upward toward the 0.6147 top via a trendline.
✔️ Currently, this trendline has been broken, and a new support level has formed at 0.4888, which has been tested several times.
✨ If this 0.4888 level breaks, a short position targeting the 0.45 zone and 0.3939 becomes viable.
📈 For a long position, the first trigger is the 0.5266 level. A breakout here would confirm support at 0.4888 and open the path toward the 0.6147 resistance.
🎲 The RSI oscillator is hovering near the 50 level. A sustained move above this could increase the likelihood of the bullish scenario playing out.
📝 Final Thoughts
This analysis reflects our opinions and is not financial advice.
Share your thoughts in the comments, and don’t forget to share this analysis with your friends! ❤️

Potential Buy Trade on SONIC/USDT (1h Timeframe)Potential Buy Trade on SONIC/USDT (1h Timeframe)
Entry: Around 0.49
Target: Around 0.5700
Stop Loss: Around 0.4477
This appears to be a potential long setup following a downtrend, possibly anticipating a bounce or reversal.

SONICUSDT 1D Analisis S / SET:SONIC ~ 1D Analisis
#S / #SONIC Buy gradually from here if you still have confidence in this coin with a short term target of at least 10%+ From here.

updateIs Sonic forming an ascending triangle? Sonic is acting confusingly and the market maker is probably planning a big rally after collecting all of Sonic from the public.
S = 55$
S or old FTMAs a blockchain platform the price of S with a stable growth ecosystem must be over 2$ not such prices,and I dont understand the traders of this coinn vs Sui or others....lets push it to the Moon...

SONIC preparing for departure. SONIC is still within range and has not broken out. Price action is at the top of the range and is technically at resistance. Longing into resistance is not the best strategy; however, a breakout could happen anytime. Consider laddering in within the range, preparing for any possible BTD opportunities.
Full TA: Link in the BIO

S/USDT Potential UpsidesHey Traders, in today's trading session we are monitoring S/USDT for a buying opportunity around 0.5850 zone, S/USDT is trading in an uptrend and currently is in a correction phase in which it is approaching the trend at 0.5850 support and resistance area.
Trade safe, Joe.

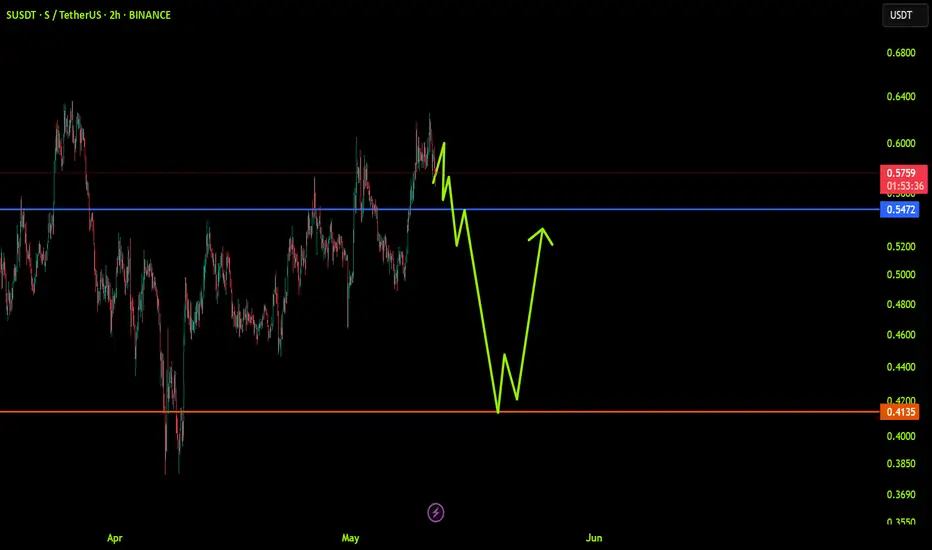
SUSDT: trend in 2H time framesThe color levels are very accurate levels of support and resistance in different time frames, and we have to wait for their reaction in these areas.
So, Please pay special attention to the very accurate trend, colored levels, and you must know that SETUP is very sensitive.
Be careful
BEST
MT