SUSDT , long opportunity
Sonic (SUSDT) is currently trading within a long-term ascending channel on the weekly timeframe, indicating a bullish macro structure. Price action has respected both the upper and lower bounds of the channel multiple times, showing strong trend continuation behavior.
On the daily timeframe, Sonic is currently forming a falling wedge pattern, which is typically a bullish reversal pattern. However, the price is still trading below the descending resistance line of the wedge, suggesting that a breakout has not yet occurred.
Key levels to watch:
Immediate resistance is the upper boundary of the wedge and the descending trendline. A breakout above this zone could trigger a bullish move toward $1.47, the next significant high.
Immediate support lies around $0.5
SUSDT trade ideas

it's Bullish BUT Wait!!Ithink we have a some liquidity in lower prices and then we can fly to 70 cents and beyond it

SUSDT - This opportunity might not come around again.!All tokens built on the Ethereum network pumped yesterday as ETH moved up by just 4%, and SONIC (S) stood out as the top performer among them, surging by around 22%.
Currently, the coin has formed a symmetrical triangle pattern, which has been broken to the upside with a massive green candle. It's now retesting the 0.382 Fibonacci level — a key zone to watch for continuation.
This is a massive investment opportunity to buy the token at around $0.55 only.
The long-term targets for S in 2026 are insane — the most conservative target for now is $1.20.
Best regards Cecilion🎯

SUSDT Potential UpsidesHey Traders, in today's trading session we are monitoring SUSDT for a buying opportunity around 0.4890 zone, SUSDT is trading in an uptrend and currently is in a correction phase in which it is approaching the trend at 0.4890 support and resistance area.
Trade safe, Joe.

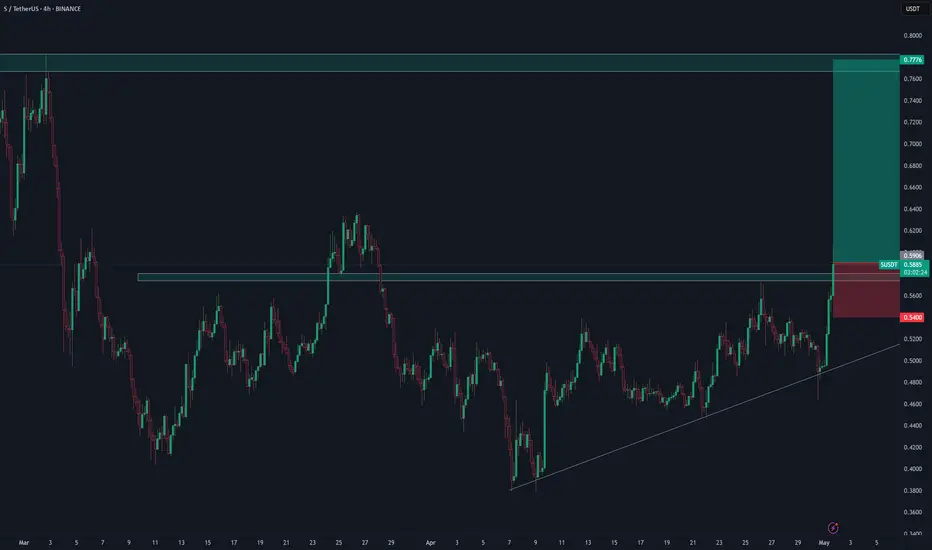
long SonicSonic broke through a major resistance level. Bullish movement is expected to continue and reach $0.77
Sonic is at a good level to get the support it needsS is going sideways in a tight range. RR is as good as it gets. Trend and momentum oscillators are showing signs of bullish strength, however, Sonic price action has not left the station. Buy low, sell high.
Full TA: Link in the BIO

Sonic Token consolidation| Price Action| Trend Sonic Token has been consolidating inside a well-defined range for 48 days, with no breakout confirmation yet. Price action remains suppressed beneath strong resistance layers including the VWAP SR, the 0.618 Fibonacci retracement, and the value area high.
Volume remains steadily below average, reinforcing the idea of rotational movement. Until volume spikes significantly, price action is expected to continue oscillating within the range. Sonic Token is currently sitting near the midpoint of the range — losing this level could trigger a cascading move toward untapped liquidity below, sweeping lower supports.
If price manages to reclaim the VWAP SR resistance with a confirmed closing candle, a move back to the range high becomes likely. Until then, the overall bias remains neutral to bearish, with the expectation of further consolidation unless strong volume intervention shifts the market structure.


SUSDT: trend in daily time framesThe color levels are very accurate levels of support and resistance in different time frames, and we have to wait for their reaction in these areas.
So, Please pay special attention to the very accurate trend, colored levels, and you must know that SETUP is very sensitive.
Be careful
BEST
MT

Sonic BoomSonic has retraced from 1$ to pretty much again 0.38 and now it has made Inverse Head and Shoulders on 1D and same on 4H
accumulate around 0.40 & 0.46
can Pump target 0.73$
50% pump
Sl daily close below 0.37

S (EX FTM) Update (4H)Like many other altcoins, S has formed an Inverse Head and Shoulders pattern, signaling a potential trend reversal.
Additionally, a bullish flag formation has broken out on the lower timeframes, further confirming the upward momentum.
The current price structure appears suitable for long positions, especially with confluence from multiple technical signals.
A conservative target lies around the $0.64 level, based on the measured move projections from the flag and neckline breakouts.
— Thanks for reading.


Short position SUSDT RR=3Short position for swing style in SUSDT
TP and SL is obvious.
if you have any question leave a comment

SUSDTHello to all AMKT friends, I hope you had a good day.😍
Let's move on to the analysis of Coin S.
In the monthly timeframe, we do not have specific data due to the newness of the project.
But in the weekly timeframe, we are involved in the box range between the prices of 0.4385 and 0.5497, and exiting this box range along with increasing volume can cause a sharp move, and because of the recent days when the market has been bullish, we know that the probability of exiting above the box range is higher.
In the daily and 4-hour timeframe, we also exited the descending triangle pattern, and usually after this event we see a range and then an upward move. So for a long position, we can enter a long position after breaking 0.5497 and increasing volume.
Have a good and profitable day

S Token Breakout Play – Fibonacci Level in FocusThe chart for S is shaping up well, especially with price action testing and now breaking above the 50% Fibonacci retracement level at $0.52. This breakout zone often acts as a pivotal shift in sentiment from consolidation to continuation.
📍 Entry:
Around $0.52 breakout confirmation
🎯 Take Profit Targets:
🥇 $0.60
🥈 $0.70
🛑 Stop Loss:
$0.49 (just below the breakout level to protect against fakeouts)

$S (sonic network) ShortBased on last week's volume profile
Hourly PA failing last week's point of control. Buyers are not stepping in here.
Targeting last week's value area low on the volume profile

SONICUSDT 12HS / SET:SONIC ~ 12H Analysis
#S / #SONIC Buy after successfully penetrating this resistant line with a short -term target of at least 10%+ from here.

S Token key support and resistance levels, breakout soon. Hello traders,
In today’s analysis, we’re taking a closer look at S-token and its current price action. The current structure shows two converging trendlines, often referred to as dynamic support and resistance. These lines are forming an apex, a pressure point where price will soon be forced to make a decisive, impulsive move. At present, price is sitting at clear resistance, and what happens here will shape the next trade opportunity.
S-token is currently trading at key resistance within a converging structure.
A rejection here could send price back to the lower dynamic support.
A break below support followed by a quick reclaim offers a strong long opportunity.
This setup allows for a high-reward entry if patience is exercised. A deeper retest of support will not only confirm the range but also present a more reliable long entry with tighter risk management.
Until then, price remains capped by resistance. Traders should remain reactive, watching for either a clean breakout or a breakdown and reclaim scenario to confirm the next leg of the move.

S looking for a major bounce. 2 levels to watch forS is trying to find its bottom and as long as the price stays above 0.37 it may have achieved it. A breakdown to the 1.68 fib extension will take the price to the next horizontal support found on the FTM chart.
Full TA: Link in the BIO

Short-Term Trading Plan for S/USDT (4H Chart)1. Entry Zones:
Conservative Entry: Wait for a pullback to the 0.4993–0.4880 support zone (around Fibonacci 0.236 level).
Aggressive Entry: Enter after a confirmed breakout and strong bullish candle close above 0.5163 resistance.
---
2. Take-Profit Targets:
---
3. Stop-Loss Levels:
Conservative Entry SL: Below 0.4700 (beneath Fib 0.382 support).
Aggressive Entry SL: Below 0.5100 (in case of false breakout rejection).
---
4. Risk/Reward Ratio (RRR):
Conservative Entry: ~2.5 to 3
Aggressive Entry: ~1.8 to 2.5
---
5. Entry Confirmation Checklist:
Bullish crossover in Stochastic RSI
RSI holding above 50
Strong bullish candlestick pattern (e.g. Marubozu, Bullish Engulfing)
---
6. Additional Notes:
Use position sizing (e.g. 30% initial, 30% on pullback, 40% after breakout)
Move SL to breakeven after TP1 hits
Consider trailing stop for TP2 and

Breakout Confirmation with Retest? $S Eyes Potential Rally S has just broken above a key descending trendline on the 8H chart, indicating potential bullish momentum ahead


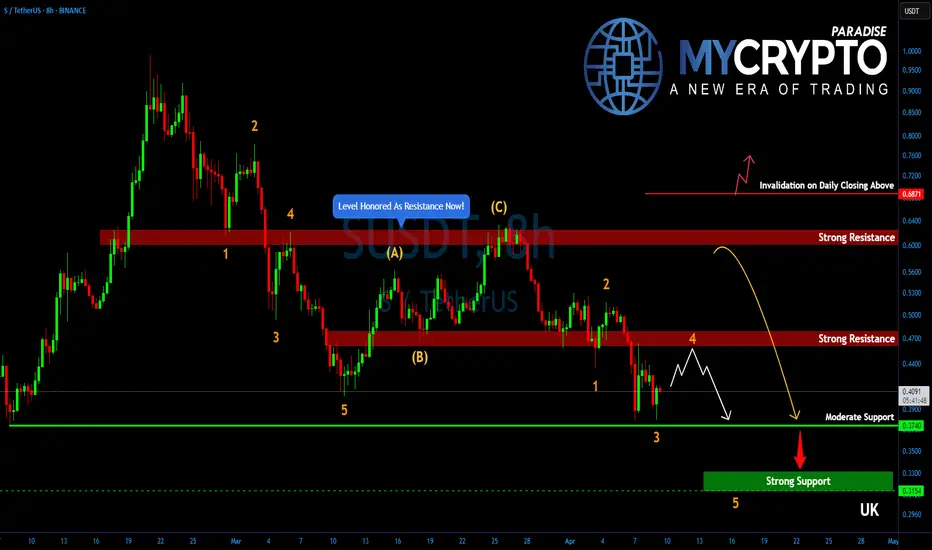
SUSDT Still in Trouble – Is the Worst Yet to Come?Yello, Paradisers! Are you letting this short-term bounce on #SUSD fool you? Be careful. What looks like a recovery could just be a deceptive pause before the next major drop hits.
💎After topping out just shy of the psychological $1.00 mark, SUSDT has entered a significant zigzag corrective structure. Despite the recent bounce, the bigger picture still suggests that the market is setting up for one more leg to the downside, where the real bottom might finally be reached.
💎#SUSDT has printed a short-term double bottom around the $0.38 level, positioned slightly above a moderate support zone. This has triggered a minor bullish push, offering a temporary sense of relief for bulls. However, based on the current market structure, this move is likely to be short-lived and part of a broader corrective pattern.
💎The resistance zone between $0.465 and $0.4720 is now the key level to watch. It’s a strong supply area where selling pressure is expected to return with intensity, making it difficult for buyers to gain control. If price gets rejected from this zone, a drop back toward the $0.3740 level is highly probable, as this area serves as the next moderate support.
💎The structure on SUSDT is far from done to the downside. If the rejection plays out as expected, the price could slide even lower, targeting the $0.3300 to $0.3150 range. This is where the final drop may conclude and a proper base for recovery could finally be established.
Paradisers, strive for consistency, not quick profits. Treat the market as a businessman, not as a gambler.
MyCryptoParadise
iFeel the success🌴