Sushiswap | All-Time Low & Volume Signal (1,200% Potential?)This is a true All-Time Low, and here it is coupled with our classic and very strong volume signal.
Ready for more my friend?
If you are reading this now, September 2024, you are doing great already. You have amazing timing and something must be really right with you. The majority of people are scared to look at these charts right now and would never even consider getting close to these trade-ideas let alone buy these altcoins, but, guess what? This is the best time to read, to prepare, to shop-around... It is the best time to buy.
Sushiswap (SUSHIBTC) just hit its lowest price in more than four years. Early August 2025.
Notice the huge signal through the buy volume on the 5-Aug. week.
Now, this signal is not available in other exchanges, which shows that it pays to shop around.
I will not inconvenience you with much technical jargon and instead will go straight to the point.
The opportunity for growth/profits is huge, but conditions can always change.
➖ If the market (this is another way traders call the trading pairs) moves lower, you can always hold/wait patiently until it rises again.
➖ If you are one of the fortunate human beings with enough capital to spare, if the market moves lower, feel free to buy more/buy again.
The entire strategy right now is based on accumulation. The whales are going through an "accumulation phase."
The whales buy, buy and buy for 6 months straight. When the bull-market is on, they wait. When a certain level is hit, they sell, sell and sell, for several months straight.
We are not whales but we can buy at the bottom and sell at the top.
We can buy low because we have our edge, we can read the charts.
Professional traders always say that you need an edge to trade successfully. Our edge is our philosophy of life, our life experience and the fact that we can read the charts with a high level of accuracy.
Instead of going through the trouble of being in front of a screen 24/7 to catch a 1% move, and lose it all the next day, we get the bottom of the bear market and ride up the entire bullish phase.
When the market is up, as in March 2024, we step aside and let the correction run its course. When the bottom is in, we join again... Of course, we are bulls but at the same time we let the bears know what is happening so they can also make their moves.
The market cycles through up and down, up and down... Forever, it is like night and day.
It is just a replay of one of the most obvious cycles of nature but based on different timing and long-term.
This is a new, young, growing and evolving market.
The trend is up long-term.
Not all markets are the same. Some are bad, some are down, some die... But we are looking at Cryptocurrency and this technology is new and young.
This is like Internet before it became what it is today.
If you can put your hands on some Crypto, go ahead... You will be rewarded by the market in due time. It can take years, but it is wiser to invest in the future rather than the past. Don't you agree?
Thank you for reading.
Namaste.
SUSHIBTC trade ideas

SUSHI/BTC 1DSushi looks good vs BTC
I am looking for a trade after brake and retest of the blue area for next more then 100% uptrend

✳️ SushiSwap Breaks Downtrend, 200% Short-Term Bullish PotentialI have written all the details on the chart so everything is very clear to see.
SushiSwap broke a strong downtrend recently, as the downtrend ends trading volume starts to rise. These are signals indicating a change of trend.
➖ Volume declines as new lows are hit;
➖ Volume rises as the market direction changes.
Momentum is leaning towards the bulls —the green side, the growth side.
👉 This can lead to massive growth in a period of 3-6months, but short-term we can easily see between 120% and 200%.
Short-term in this case can be within 1-2 months but it can also take three... The ALTSBTC wave is just starting so we need to wait longer to see how fast it will go and for how long it will develop, still, potential is bullish and we are set to experience growth.
This is good.
Thanks a lot for your support.
Namaste.

#SUSHIBTC - Approaching a Critical Pinch within WedgeWell, something dramatic is going to happen pretty soon with #SUSHIBTC. We've got a symmetrical triangle reaching pinch point and SR levels pretty evenly distributed above and below the current price.
CTv2 is showing a Buy signal currently but whichever way the price ends up going, we think it'll be between 20-40% of movement.
If you enjoyed or agree with this idea - drop us a comment, like & follow! :)

$SUSHI/#BTC [#SushiSwap]: Failure_Swing◳◱ We've detected a Failure Swing pattern on the $SUSHI / $BTC chart. This pattern is a bullish indication and could indicate a potential trend reversal. The next resistance key levels are at 0.0000616 | 0.0000646 | 0.0000708 and the major support zones are respectively at 0.0000554 | 0.0000522 | 0.000046. It is a bullish indication and we may consider buying at the current price zone of 0.000062 and targetting higher levels.
◰◲ Technical Metrics :
▣ Mrkt Price: 0.000062 ₿
▣ 24HVol: 62.582 ₿
▣ 24hChng: 5.442%
◲◰ Pivot Points - Levels :
◥ Resistance: 0.0000616 | 0.0000646 | 0.0000708
◢ Support: 0.0000554 | 0.0000522 | 0.000046
◱◳ Indicators recommendation :
▣ Oscillators: NEUTRAL
▣ Moving Averages: STRONG_BUY
◰◲ Technical Indicators Summary : STRONG_BUY
◳◰ Market Sentiment Index :
▣ News sentiment score is N/A
▣ Twitter sentiment score is 0.61 - Bullish
▣ Reddit sentiment score is 0.58 - Bullish
▣ In-depth SUSHIBTC technical analysis on Tradingview TA page
▣ What do you think of this analysis? Share your insights and let's discuss in the comments below. Your like, follow and support would be greatly appreciated!
◲ Disclaimer
Please note that the information and publications provided are for informational purposes only and should not be construed as financial, investment, trading, or any other type of advice or recommendation. We encourage you to conduct your own research and consult with a qualified professional before making any financial decisions. The use of the information provided is solely at your own risk.
▣ Welcome to the home of charting big: TradingView
Benefit from a ton of financial analysis features, instruments and data. Have a look around, and if you do choose to go with an upgraded plan, you'll get up to $30.
Discover it here - affiliate link -

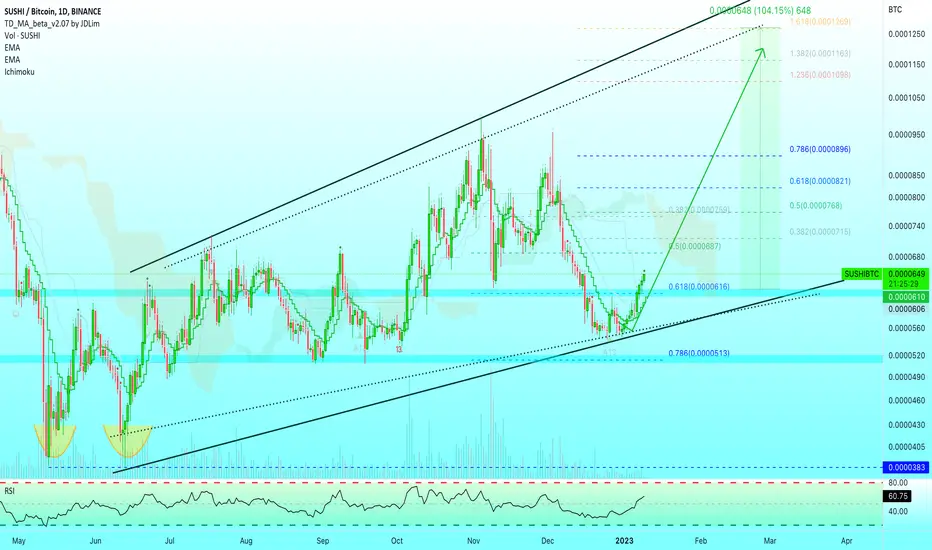
✳️ SushiSwap Double Bottom & Rising Channel (100%+ Potential)I can see this pair rising... SushiSwap vs Bitcoin.
In this chart we can appreciate a double bottom between May/June 2022, marked yellow.
After 383 satoshis is confirmed as support a new bullish wave develops... We have higher highs and higher lows...
It is easy to see SUSHIBTC continue straight up.
Next high territory in the short or even mid-term is sitting at 0.0001269 for 100%+ potential profits.
Namaste.

SushiSwap (SUSHI) completing the leg of Cypher for upto 15% pumpHi dear friends, hope you are well and welcome to the new trade setup of SushiSwap ( SUSHI ) with Bitcoin pair.
Previously we caught a nice pump of SUSHI:
On a 4-hr time frame, SUSHI is about to complete the final leg of bullish Cypher pattern.
Note: Above idea is for educational purpose only. It is advised to diversify and strictly follow the stop loss, and don't get stuck with trade

SUSHIBTC Upward Trend and Important LevelsSUSHIBTC, upward trend and important levels of support and resistance lines...

SushiSwap (SUSHI) formed bullish Crab for upto 17.5% pumpHi dear friends, hope you are well and welcome to the new trade setup of SushiSwap ( SUSHI ).
Previously I shared a long-term trade-setup for Sushi , which is still in play:
Now on a 4-hr time frame, SUCHI has formed big bullish Crab pattern.
Note: Above idea is for educational purpose only. It is advised to diversify and strictly follow the stop loss, and don't get stuck with trade

SUSHI / BTC breaks the downtrend.The picture explains itself.
Price just closed above the weekly trendline resistance and looking bullish..
It may target a 1000 sats in coming days.
Let's wait and watch!!
Safe trading.

SushibtcHi. Sushi's chart is the same of cakebtc chart. I think we have about minimum 80% grow in sushi's chart. For sushi usdt about 2.5 to 2.8 for short term target. Falling wedges are my likely patterns. Good luck.

SUSHIBTC - UPDATESUSHIBTC price breakout and trying to stabilize itself, We are expecting a good upside move towards the upside.

SushibtcHi. Sushi is try to break up. If it done successfully, we see pump in price soon.
Positive conditions : momentum, oversold zone, long correction
Negative condition: low transaction volume.

#sushibtcafter long time down trend #SUSHIBTC ready for break out
entries and targets are in pictures
be patient and risk management

🍣. 🍱hi 🖖🏼
,,,i think SUSHIBTC have a powerful support zone on greenZ,...so i'm buyer at greenZ and SL if white get close below
as always TP on redZ
but cause of BTC.D this trade is very risky,...so i'll take that with a little balance
#NFA
#DYOR 💚 🥂

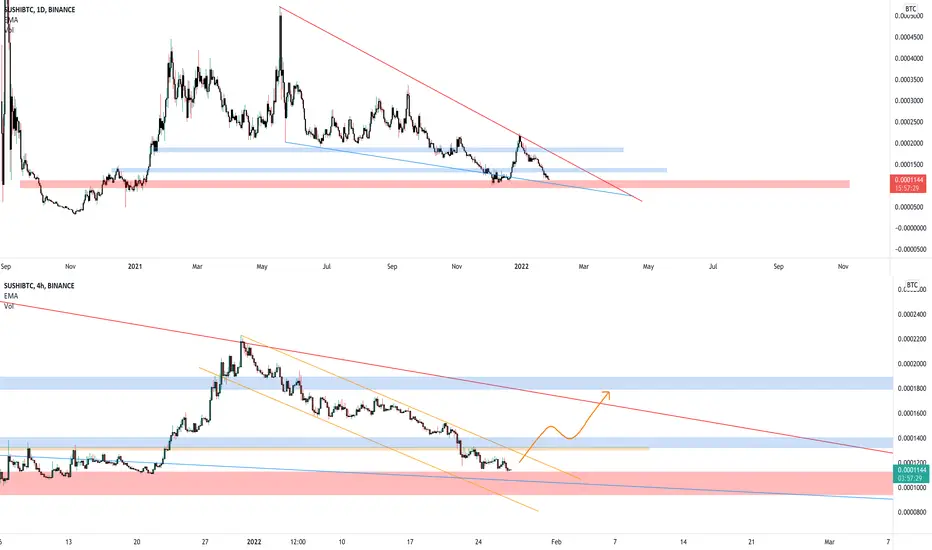
SUSHIBTC is testing the weekly supportThe price is testing the weekly support on 0.0011, it's a key level as you can see from the upper chart (Daily timeframe)
On the lower chart (4h timeframe) the market is creating a descending channel, and after the breakdown from the daily support, the market retested it as new resistance.
How to approach?
We need to wait for a breakout from the daily resistance and 4h Descending channel and if the market shift from bear to bull, we can add in our watchlist and wait for apply our rules for a new long position.
–––––
Follow the Shrimp 🦐
Keep in mind.
🟣 Purple structure -> Monthly structure.
🔴 Red structure -> Weekly structure.
🔵 Blue structure -> Daily structure.
🟡 Yellow structure -> 4h structure.
SUSHI/BTC TRADE SETUP! BULL FLAG BREAKOUT!!Hello everyone, if you like the idea, do not forget to support with a like and follow.
Welcome to this SUSHI/BTC trade setup. SUSHI looks very bullish here.
It's already breaks out from the bull flag like structure in 8h timeframe and also retest is done. After the retest it's making a green cadle which is the confirmation of the trend. So buy some now and add more in dips.
Entry range:- 1580- 1680 sats
Target1:- 1890 sats
Target2:- 2280 sats
Target3:- 2840 sats
Target4:- 3290 sats
SL:- 1420 sats
If you like this idea then do support it with like and follow.
Also, share your views in the comment section.
Thank You!

Bearish Shark Sushi/BTCfurther confluence for my sushi short i posted earlier
sushi to underperform btc

Sushi Can Recover After Long-Term CorrectionSUSHIBTC peaked in May 2021.
Here we are looking at Sushi's long-term chart since August 2020 on the weekly timeframe.
We can see that after May's price peak we had a long-term correction.
After hitting a low in late November, right below the 0.786 Fib. retracement level, we have some green candles.
Today SUSHIBTC is back above the 0.786 Fib. retracement support and also challenging the most important EMA10 level.
If SUSHIBTC can break and stay above 15,000 satoshis (0.00015000), we can expect additional growth.
The support we set it at the last low at 0.00010000.
Remember to build your own plan before you trade.
Good luck.
This is not financial advice.
Namaste.

Are we headed to $12? Part 2Similar to the SUSHIUSD price chart. The SUSHIBTC price chart looks like is in a bull flag pattern. Assuming that SUSHI gets to the the top around mid January a $12 SUSHI and .0002267 SUSHIBTC would place BTC price at around $53k (Extended cycle? BTC oscillating around $50-$60k for the next few months?)
At the end of the day the main point of these charts are to identify a trend. For a while it looked like the SUSHIUSD chart was in some type of pennant which is why I believe us HODLers where shocked once it broke down. Assuming we are still in a bull market I think the high $4s-low $5s are a solid short term bottom. If the channel plays out look for the top of the channel to take some profits.

Sushi/BTC WedgeSushi looks to be in a falling wedge/flag pattern vs btc. losing the lows and reclaiming will be a bullish signal for higher. Retest rejection wont be as "fun."

SUSHI - underperforming. rally time?There are some indications on the USD chart as well, but here SUSHI just hit an important historic support/resistance level vs BTC. If this holds as support, could be a good sign of bottom.
SUSHI has underperformed other alts and other doxes, while still being one of the top 3 in terms of volume.
