SUSHI - undervaluedPerfect accumulation/bottoming out set up. Will not happen overnight but looks ready to me.
SUSHIUSD trade ideas

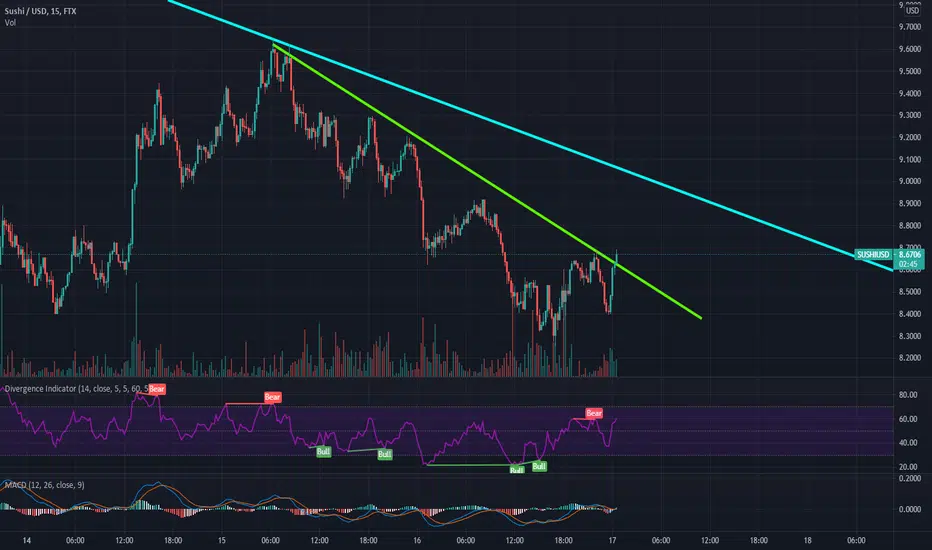
50EMA is holding, for how long ?#SUSHI/USD TA Update:-
$SUSHI is currently trading at $8.15
SUSHI is still in his ascending channel and 50EMA is holding in 4h chart.
We can see a retest at 7.75 before a rebound. If not, it can also retest the previous support that he broke july 4th around 6.74.
I am watching for now.
Please click LIKE button and Appreciate my hard work.
Must follow me for latest crypto real time updates.
Thank you.

SUSHI - $16.27SUSHI is currently trading just above the support zone of $7.10. If it can stay above this support, we could start seeing a move towards $8.18, $8.44, $9.26, $10.60, $12.77, $14.93 and $16.27. Failure to hold the support at $7.10 could lead to a drop towards $6.33 and $5.67.

Sushi (SUSHI) - June 17Hello?
Welcome, traders.
By "following", you can always get new information quickly.
Please also click "Like".
Have a good day.
-------------------------------------
(SUSHIUSD 1W Chart)
We need to see if we can hold the price above the 7.0498946 point and continue the uptrend.
If it goes sideways in the 10.8528552-17.3510977 section, it is expected to lead to a large uptrend.
(1D chart)
It remains to be seen if the price can sustain in the 7.9443046-11.6706336 segment.
In particular, we should watch to see if we can move up along the uptrend line.
If it goes down, you should check to see if it finds support at the 6.0811401-7.9443046 zone.
As long as it does not fall below the downtrend line, an uptrend is expected.
To convert into an uptrend, it needs to move above the 10.8528552 point and find support.
However, if you do not deviate from the two downtrend lines, you should trade conservatively as there are restrictions on the uptrend.
If it fails to break above the 10.8528552-11.6706336 section and falls, it is expected that the downtrend will continue, so careful trading is required.
-------------------------------------
(SUSHIBTC 1W chart)
It remains to be seen if the price can sustain above the 0.0002254 point.
In order to continue the uptrend, we need to watch if it moves along the uptrend line.
(1D chart)
It is important to keep the price in the range 0.0002248-0.0002796.
If it continues to fall, you can touch the 0.0001425-0.0001699 range, so you need to trade carefully.
It needs to find support at least above the 0.0002486 point to turn into an uptrend.
However, if it does not rise above the 0.0002796-0.0003070 section, it can maintain a downtrend, so careful trading is required.
------------------------------------------
We recommend that you trade with your average unit price.
This is because, if the price is below your average unit price, whether it is in an uptrend or in a downtrend, there is a high possibility that you will not be able to get a big profit due to the psychological burden.
The center of all trading starts with the average unit price at which you start trading.
If you ignore this, you may be trading in the wrong direction.
Therefore, it is important to find a way to lower the average unit price and adjust the proportion of the investment, ultimately allowing the funds corresponding to the profits to regenerate themselves.
------------------------------------------------------------ -----------------------------------------------------
** All indicators are lagging indicators.
Therefore, it is important to be aware that the indicator moves accordingly with the movement of price and volume.
However, for the sake of convenience, we are talking in reverse for the interpretation of the indicator.
** The wRSI_SR indicator is an indicator created by adding settings and options to the existing Stochastic RSI indicator.
Therefore, the interpretation is the same as the traditional Stochastic RSI indicator. (K, D line -> R, S line)
** The OBV indicator was re-created by applying a formula to the DepthHouse Trading indicator, an indicator disclosed by oh92. (Thanks for this.)
** See support, resistance, and abbreviation points.
** Support or resistance is based on the closing price of the 1D chart.
** All descriptions are for reference only and do not guarantee a profit or loss in investment.
Explanation of abbreviations displayed in the chart
R: A point or section of resistance that requires a response to preserve profits.
S-L: Stop Loss point or section
S: A point or section where you can buy to make a profit as a support point or section
(Short-term Stop Loss can be said to be a point where profit and loss can be preserved or additional entry can be made through split trading. It is a short-term investment perspective.)
GAP refers to the difference in prices that occurred when the stock market, CME, and BAKKT exchanges were closed because they are not traded 24 hours a day.
G1 : Closing price when closed
G2: Opening price
(Example) Gap (G1-G2)

Sushi outlook represented by a 1:1.5 RR setupThis idea is supported by a bearish DXY premise with the old low being targeted denoted on the left. With this in mind, sushi appears to be dropping lower to trap sellers before rallying higher.
Any closure below the red line invalidates this idea. Any closure above the TP into the rocket will likely see new ATHs.
Let's see.

SUSHI - MEGA OversoldWell seems like every crypto genius is quiet on Twitter for past week. A few peeped something about bottoming out 3 days ago and have made a single comment since.
My suspicion is telling me that every crypto genius is putting 50 valerian root drops in their not chilled, raw, Silverwolf vodka at this current moment.
Who is gambling this weekend?

MY MINIMALIST CHART ANALYSIS FOR $SUSHISWAP$SUSHISWAP- SUSHISWAP ON A DAILY CHART
6.11.21 0816H +8 PACIFIC
MY PRACTICE MINIMALIST ANALYSIS
ENTRY AND EXIT POINTS FOR A SWING TRADE
USING RANGE BOXES AND FIBS (NO INDICATORS)
MULTIPLE REJECTION ON KEY LEVEL OF SUPPORT
OPENING POSITION FIRST ENTRY WITH A TIGHT STOP LOSS.
2ND ENTRY FROM $6 to $8 with tight stop loss.
Monitoring what the market does soon after.
Please do feel free to comment on my idea.
I would greatly appreciate it so as for me
to learn more. Thank You.


SUSHI - still in downtrendLove SUSHI and I'm a strong holder. Looking at the new map looks like a downtrend will wait to break out


Sushi- 10 is strong support at this momentAfter the false break under 10 figure, Sushi recovered losses and is trading comfortably above this support. I expect a continuation from this coin and 16.50 could be bulls target.
Interim resistance is around 14

SUSHI(USD) Technical Overview ~Update~ DUMP, then PUMPHello!
This is an update on SUSHI-USD (SUSHISWAP🍣) I am expecting a down-wave before we see more pump.↘↗📈 (I am looking to buy at approximately $9.3)
SUSHI is fundamentally extremely strong especially now that it has teamed up with POLYGON (MATIC) network about 2 months ago.
Let's see where this takes us! If you would like more fundamentals on SUSHI I have attached some other relevant ideas to this post.
🛑🛑This is not financial advice🛑🛑🛑 Above are approximate targets based on fibs, major trend-lines, etc.. I always recommend looking at multiple charts when making a big investment, thank you!
Always have a stop loss ✋🛑💲 set
Any thoughts 💭💡, questions 🙋♀️🙋♂️❓, good 👍, bad👎, happy 😄 or sad 😥, always welcome.
Thank you so much!
Jazerbay 🐶

Update: SUSHI: Falling Wedge - Dip + Buy - Target $30SUMMARR: Bullish, correction completed.
Mostly the same as previous analysis (see link below)
-- Technical --
Full 4.236 Fib extension provide price indication for $75.
Pricing actions has pushed through lower Bollinger Bands for several days, looks set for price reversal to the upside - bullish
-- Fundamentals --
Number 2 DEX platform after Uniswap.
$$$ Happy Bull Market $$$
Please HIT the --->>> "LIKE" and "FOLLOW" button. <<<----
*Not financial advice and is for educational purposes only. Always DYOR.
Got questions? Shoot.

SUSHI 1100% Opportunity LONG trade$SUSHI this time, it shows strenght AF, this time the Fibonacci 4.618 goes to 1100% without leverage even, so thats a 10X trade, and a 100X on 10X leverage, it is possible to set your Stoploss at a nice Break-even also, this aint gonna go lower anymore, BTC is performing a Double bottom as we speak. With Bull-Div. but apart from this is HEX the best thing to go in if you cant trade well, set your stakes in a ladder and with Pulse-chain the fees shoudl be okay from next month on.


Sushi primed for big movesPrices have followed Fibs, then bounced back to major tend lines for a good time.
Currently looking like the upper trend is going to become the new support. If this support holds for a few days, I have high hopes for this to spike up 🚀

