[Deep Dive] SUSHI – Edition 3: Accumulate. Anticipate. Accelerat🧠 Cycle Anatomy: What the Chart Is Telling Us
📉 Phase 1: Markdown
The bears dominated, slicing price downward into key historical support around the $0.50 mark — the same level that anchored the previous accumulation zone.
📦 Phase 2: Accumulation
Both accumulation phases (mid-2023 and Q2 2025) occurred near identical support zones, with rounded bases and sideways chop — signaling strong hands quietly absorbing supply.
📈 Phase 3: Markup Incoming?
Following breakout point “1” and retest point “2,” the current structure aligns remarkably well with the previous markup phase — which propelled SUSHI from ~$0.50 to over $3 in just weeks. While past performance isn’t a guarantee, this fractal deserves attention.
🔥 Why Fundamentals May Support This Move
- SushiSwap v3 continues rolling out on multiple chains, optimizing capital efficiency and fee structure for LPs.
- Governance has stabilized after the rough patches of 2022–2023, with more transparent treasury and development direction.
- Cross-chain expansion and integrations with major aggregators (like 1inch, Matcha, and DeBank) are boosting SUSHI’s visibility in the broader DeFi flow.
Additionally, a surge in TVL and DEX activity on low-fee chains could redirect volume back to SushiSwap — a platform known for its cross-chain capabilities.
📍 What to Watch Next
- A confirmed breakout above $1.00 would validate the “markup” thesis.
- A dip toward the $0.65–$0.70 zone could offer a high-risk/reward entry aligned with point “2.”
- Failure to hold the $0.50 level would invalidate the structure.
For now, the rhythm is clear: markdown → accumulation → markup. And if the pattern holds, SUSHI might just be preparing for its third vertical.
💬 Do you think this is just another fakeout — or is SUSHI gearing up for a DeFi comeback?
🔔 Disclaimer: This post is for educational and informational purposes only. It does not constitute financial advice. Always do your own research and manage risk carefully.
📚 Always follow your trading plan => including entry, risk management, and trade execution.
Good luck!
All strategies are good, if managed properly.
~ Richard Nasr
SUSHIUSDT trade ideas

SUSHI LONG TERM POSITIONGoing to be entering at the .618 Fib level (Golden Pocket) for a long position.
ETH has been pumping, this money will start rotating soon enough and i'm betting sushi swap will get a nice pump in the upcoming weeks...

SUSHIUSDT at a Critical Pivot Golden Pocket Retest or Bull Trap?📊 Full Daily Chart Analysis (1D) — KuCoin
After months of dull sideways movement, SUSHI is finally showing signs of life! A strong breakout above a long-term consolidation range has pushed price up to the key resistance at $1.03, raising the possibility of a mid-term trend reversal.
However, the price is now entering a pullback phase. The key question:
Is this just a healthy correction before the next leg up—or the beginning of another downward move?
---
🔍 Structure & Pattern Breakdown:
Rounded Bottom Formation:
Formed from April to July 2025, this pattern signals a shift from accumulation to potential bullish expansion.
Confirmed Breakout:
A breakout above the neckline at $0.80, supported by increasing volume, suggests this move is legitimate—not a fakeout.
Golden Pocket Retest (Key Fibonacci Zone):
Price is currently pulling back into the Fibonacci Golden Pocket (0.5 at $0.7992 and 0.618 at $0.7295) — the most ideal technical zone for a bullish re-entry. This area also aligns with a strong historical demand zone.
---
📈 Bullish Scenario (Primary Case):
If daily candles hold above the $0.7295–$0.7992 zone and form a strong reversal signal (e.g. bullish engulfing or hammer):
Price is likely to retest $1.03 (minor resistance).
A successful breakout above $1.03 could lead to a rally toward:
🔸 $1.3374 – Previous horizontal resistance
🔸 $1.8307 – Key psychological level & March 2025 swing high
🔸 $2.6591 – Fibonacci extension target
🔸 $2.8195 – Major high from November 2024
This could mark the beginning of a mid-term bullish trend if volume continues to build.
---
📉 Bearish Scenario (Alternative Case):
If the price fails to hold above the Golden Pocket and breaks below $0.7295:
A deeper correction is likely, with price revisiting $0.60 or even retesting the bottom zone at $0.4515.
This would invalidate the bullish setup and confirm a bull trap.
---
🧠 Conclusion:
SUSHI is at a decisive moment. This retest of the Golden Pocket will determine whether this is simply a healthy pullback within a new uptrend, or the early sign of another bearish breakdown.
> Plan the trade, trade the plan. The $0.73–$0.80 zone is the battlefield for SUSHI’s next major move.
---
📌 Key Levels:
Level Description
$0.7295–$0.7992 Golden Pocket (Fibonacci Re-Entry Zone)
$1.03 Minor Resistance
$1.3374 Bullish Target 1
$1.8307 Bullish Target 2 (Mid Resistance)
$2.6591–$2.8195 Long-Term Bullish Targets
$0.60 / $0.4515 Bearish Supports if Breakdown Occurs
#SUSHIUSDT #CryptoBreakout #FibonacciTrading #GoldenPocket #AltcoinReversal #SushiSwap #CryptoSetup #TechnicalAnalysis #BullishScenario

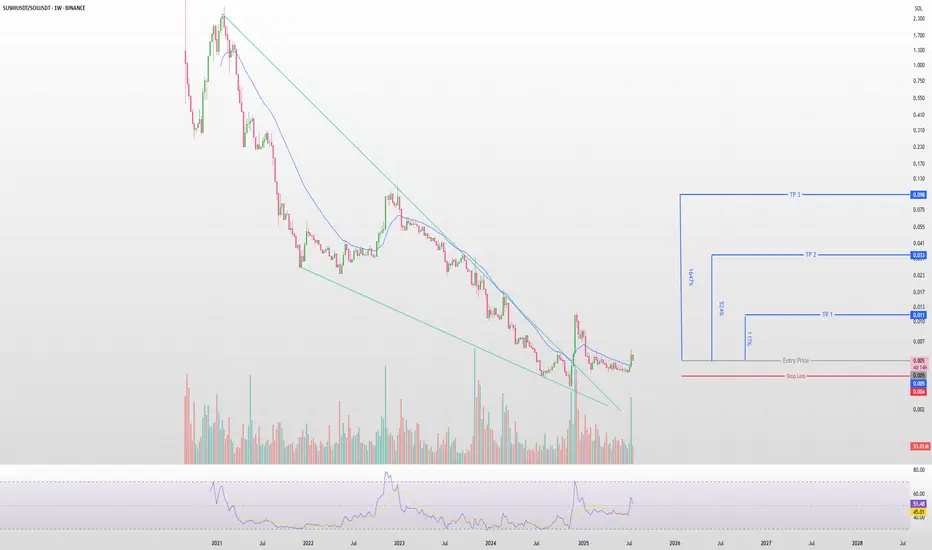
SushiSwap Ready to Serve a 1671% Move against Solana? SUSHI/SOLUSDT Weekly | Falling Wedge Breakout + High R/R Setup
After a multi-year downtrend, SUSHI has finally broken out of a large falling wedge — a classic reversal pattern. This is the first real structural breakout against SOL in over 3 years, and the volume spike confirms strong buyer interest.
📈 Technical Highlights:
✅ Breakout from Falling Wedge (long-term structure)
✅ Weekly RSI breakout from multi-year lows
✅ +171% move already confirmed from local bottom
📊 Volume surge supports a reversal
🎯 Targets based on prior resistance zones
TP1: 0.011 (224% gain)
TP2: 0.031 (541%)
TP3: 0.094 (1671%)
This isn’t just a bounce — this could be a cycle-level trend reversal.
🧠 Sentiment & Psychology:
Most have written off SUSHI. That’s exactly why this setup is powerful. The market punishes late followers and rewards early contrarians.
🛡️ Risk Management:
Always use proper stop-loss. While the setup is high probability, risk is always present.
🚀 Summary:
SUSHI vs SOL looks like a classic accumulation breakout. With a huge upside potential and strong technical structure, this might be one of the most asymmetric setups in the market right now.
📌 Add to your watchlist, set alerts, and ride the momentum.
SUSHI Nice Structure, Keep in WatchlistSushi has nice price structure
0.4 is good buying opportunity
Massive Upside for SUSHI from Key Demand Zone!CRYPTOCAP:SUSHI is bouncing strongly from a key multi-tested weekly support zone (~$0.42–$0.55), signaling a potential bottom formation. Price action shows a bullish structure with the possibility of a trend reversal. If momentum continues, we could see a rally first toward Resistance 1 at $1.25, followed by a larger move targeting Resistance 2 at $3.75.
Stop Loss: $0.43
Resistance 1:$1.25
Resistance 2:$3.75
BINANCE:SUSHIUSDT

SUSHI LONG POSITION (LONG TERM)Long term sushi trade, entered at this area, I think that a break out is going to happen any day.
TP region is around $3-5
Going in with a lot more size on this one 2-8 Week timeframe on this.

SUSHIUSDT Forming Descending ChannelSUSHIUSDT is currently forming a classic descending channel pattern, a setup that often precedes strong bullish breakouts once price action moves beyond the upper trendline. This technical structure suggests that while the price has been under pressure, it has been consistently creating lower highs and lower lows within a confined range—typically a sign of consolidation rather than weakness. Now, with improving volume and investor sentiment, SUSHI appears poised for a potential reversal that could result in a 60% to 65% gain.
The descending channel pattern on SUSHIUSDT aligns with historical accumulation zones seen in previous market cycles. These periods often attract smart money and long-term investors looking to position themselves ahead of major uptrends. The recent uptick in trading volume and the price nearing the top of the channel suggest that bulls are beginning to regain control. If a confirmed breakout occurs, the first key resistance zone lies significantly higher, giving plenty of room for growth.
SushiSwap, the DeFi platform behind SUSHI, remains an integral player in the decentralized exchange (DEX) space. As the broader DeFi narrative gains traction again, ecosystem tokens like SUSHI are seeing renewed investor interest. Combined with bullish technical signals, the fundamentals support the possibility of a strong rally in the near term, especially if market-wide sentiment improves.
✅ Show your support by hitting the like button and
✅ Leaving a comment below! (What is You opinion about this Coin)
Your feedback and engagement keep me inspired to share more insightful market analysis with you!

Sushi Turns Bullish, Major Support Zone Left Behind · $105 Next?A major support zone from November 2020 has been left behind. The launch pad for Sushi's previous bull market. Let me explain.
Right after SUSHIUSDT became available for trading late August 2020 it started a strong decline. This decline found support at a low point November 2020. To this day, this low remains the strongest and most important support for this pair and it has never been broken on a weekly close, not even once. The level was tested three times: In 2025, 2024 and 2023 and each time it gets tested a bullish wave develops.
From November 2020 through March 2021, 126 days, SUSHIUSDT went ultra-bullish, total growth amounting to 4,864%.
The bullish waves in late 2023 and 2024 were something minimal, whales buying nothing more as there was no continuation. The situation is different today.
Sushi has been accumulating for years and is ready for a full-blown bull market. This week it started trading above EMA55 on a full green candle, coupled with really high volume. This is it, the major bull market cycle and wave. It ends in a bull-run phase.
The November 2020 support is now being left behind. Sushi is preparing and has the possibility of hitting a new all-time high in late 2025. It can happen that the action goes beyond this year and into 2026.
Some pairs can produce an entire bull market bullish wave in 3-4 months. Other pairs can do so in 6 months exact. Some others go for longer and last 8 months while a different set can take 12 months or more. Some pairs have been in bull market territory (higher highs and higher lows) for years... Let's hope the entire market decides to produce long-term growth.
The low in June this year is a higher low compared to April. Here you can see the market variations. Some pairs produced lower lows and others, like this one, produced a higher low. Lower low or higher low makes no difference when it comes to the bigger picture, this is simply a technicality.
We are now entering a massive, marketwide bullish phase. You just need to be prepared for what is coming because this will be the opportunity of a lifetime. While there will always be new bear markets and bull markets, the prices we are seeing now will be forever gone. Crypto will grow so fast and so strong, that the next correction bottom will be really high compared to the most recent major low. Cryptocurrency is going mainstream and is here to stay for the long haul.
Namaste.

$SUSHI Flips Resistance into Support, Next Leg Loading?CRYPTOCAP:SUSHI Long Setup
Breakout from the Expanding channel on strong volume✅
Now flipping resistance into support, an ideal retest zone is forming.
Entry: 0.69 – 0.72
Stop Loss: 0.64
Targets:
TP1: 0.88
TP2: 1.11
Looks like momentum is building; watching for continuation after retest 🔥
DYOR | NFA
#sushi

sushiusdtsushiusdt loks like it has completed accumulation and now looking to taking out SOS . wait for next higher low for entry

SUSHI/USDT Reversal from Historical Demand ZoneThe SUSHI/USDT pair is showing strong potential for a bullish reversal from the long-term demand zone between $0.44 - $0.58, which has historically acted as a solid support area since 2021. Price has tested this zone multiple times and has bounced back, indicating significant buying interest.
🔍 Technical Overview:
Timeframe: Weekly (1W)
Key Support Zone: $0.44 - $0.58 (strong accumulation area)
Key Resistance Levels (Potential Targets):
$0.815
$1.392
$1.950
$2.765
$3.500+
Price Structure: Currently forming a possible double bottom or sideways accumulation near the macro support, often seen before bullish markup phases.
Bullish Signal: The yellow arrow illustrates a projected upward movement over the coming weeks/months if the support holds.
After a prolonged downtrend, SUSHI/USDT is now at a critical turning point, bouncing from a multi-year support zone. This accumulation phase may be the early stage of a major bullish trend. Traders should keep an eye on this setup as a breakout toward higher resistance levels could be imminent.
#SUSHI #SUSHIUSDT #CryptoAnalysis #Altcoins #CryptoReversal #TechnicalAnalysis #CryptoSupportResistance
#BullishReversal #CryptoSignals #PriceAction #ChartPattern

#SUSHI/USDT#SUSHI
The price is moving in a head and shoulders pattern on the 1-hour frame, adhering well to it, and is heading for a strong breakout upwards and retesting it, forming the right shoulder.
We have a bounce from the lower channel line to the right shoulder, which is support at 0.620.
We have a downtrend on the RSI indicator that is about to be broken and retested, supporting the upside.
We have a trend of consolidation above the 100 moving average.
Entry price: 0.629
First target: 0.637
Second target: 0.650
Third target: 0.666

#SUSHI/USDT#SUSHI
The price is moving within a descending channel on the 1-hour frame and is expected to break and continue upward.
We have a trend to stabilize above the 100 moving average once again.
We have a downtrend on the RSI indicator, which supports the upward move by breaking it upward.
We have a support area at the lower limit of the channel at 0.616, acting as strong support from which the price can rebound.
Entry price: 0.621
First target: 0.634
Second target: 0.643
Third target: 0.654

Sushiswap 1,2 Breakout Sequence Can Lead To New ATH (3,000% PP)On this chart and after reaching a market bottom Sushiswap produced a clear 1,2 breakout sequence. This sequence has been shown to produce a bullish wave.
You know what they say, "Third time's a charm," and we are on the third breakout from a long-term support.
1) In early June 2023 we have the first 1,2 breakout sequence which leads to a bullish wave that ended in March 204.
2) In August 2024 the same sequence again, and a new bullish wave ends December 2024 with a higher high compared to March.
3) Fast forward and bring yourself to this present day, April 2025 the same sequence starts as a higher low. "Third time's a charm." Here we are getting not only a higher high but it is possible even a new all-time high.
» Growth potential can reach 1,500%, 2,500% or even beyond 3,000%, it is still too early to say.
It is not early to know though that the market already hit bottom and is preparing to grow.
This is a good chart and a great project; an awesome opportunity. Buy and hold.
Namaste.

Sushi bullish again wait for bullish breakout Sushi bullish again wait for bullish breakout
.
.
.
.
.

SUSHIUSDT 1W AnalysisSUSHI ~ 1W Analysis
#SUSHI This is the lowest support for now, buy from here with a short term target of at least 15%+ from here.

Is SUSHIUSDT About to Bounce or Break? Yello, Paradisers! SUSHIUSDT is setting up an intriguing scenario after reacting to a key resistance trendline. Let’s break this down:
💎If SUSHIUSDT shows a bullish I-CHoCH (Internal Change of Character) from the key support zone—previously a resistance level—it could signal a higher probability of a bounce. However, patience is key here; we need to wait for confirmation of a bullish I-CHoCH on lower timeframes to take action.
💎On the flip side, if the price experiences further drops or shows signs of panic selling, the best approach would be to wait for it to reach a stronger support zone. At that point, we’d need to look for bullish patterns such as A W formation or An Inverse Head and Shoulders on lower timeframes to stack the odds in our favor.
💎If the price breaks down and closes a candle below the strong support zone, it will invalidate the bullish thesis entirely. In that case, it’s smarter to wait for a clearer structure to develop before considering any entries.
🎖 Remember, Paradisers, disciplined trading is the only way to achieve long-term success. Avoid impulsive decisions and always prioritize confirmation over speculation. The market rewards patience and preparation—stay sharp, stay focused.
MyCryptoParadise
iFeel the success🌴

SUSHIUSDT 1D#SUSHI is moving inside a Descending Broadening Wedge pattern on the daily chart. It’s holding above the daily MA100, which is a bullish sign, and it's on the verge of breaking out above the pattern. In case of a breakout, the targets are:
🎯 $0.977
🎯 $1.302
🎯 $1.566
🎯 $1.829
🎯 $2.203
⚠️ Use a tight stop-loss.

SUSHI Token: A High-Potential Setup You Shouldn’t IgnoreHello everyone!
A huge opportunity has emerged on the BINANCE:SUSHIUSDT chart. I’ll break down the technical analysis for SUSHI using both the Daily and 4H timeframes , highlighting key levels and potential trade setups.
On 1D timeframe
- Price has swept the liquidity below the November 2024 low , forming an inverse Head and Shoulders pattern , which is a strong bullish reversal signal.
- Price recently broke did the May high after that retraced approximately 24% . This pullback aligned perfectly with a retest of the neckline from the inverse Head and Shoulders pattern, reinforcing its validity as a bullish setup.
On 4H timeframe
- If price breaks above $0.775 , it would serve as a confirmation of bullish momentum, suggesting a likely move toward the liquidity zone above $1.00 .
- In my opinion, if market conditions remain bullish and Bitcoin continues its upward trend, SUSHI is likely to break above the $1.00 level with ease and potentially reach the inverse Head and Shoulders target around $1.20+ .
In conclusion, SUSHI is currently showing strong bullish signals, and if the broader market gives altcoins room to run, this token has the potential to rally aggressively.
Note: SUSHI is a low-cap token with high volatility, so exercise proper risk management when trading or investing.

SUSHIUSDT Potentially BullishWe've seen some pretty significant move in the the crypto market in the last few days (maybe weeks) especially wiith BINANCE:BTCUSDT hitting the 104K area. It is more than expected that most coins will follow suit.
BINANCE:SUSHIUSDT is one of such coins and as it stands, it has broken a significant zone at the 0.7175 area and attempting a retest. If the zone holds as a new found support, we just might see another significant push phase targeting the 1.32 area. Until then, fingers crossed
Updates to follow!!!
Past results does not guarantee future results

SUSHIHonestly i have not done any research why Sushi did not bounce till now, but this is just a matter of time where we could see a skyrocketing for this project.
Since December 24 sushi was in a decline channel.
As we can see the Yellow line - EMA30 it has hit the price and dropped a little.
Breakout very soon Target 1.40 - 1.60$
Keep watching it.
spot trade

SUSHI - History Repeating Itself!Dear TradingView community and fellow traders,
I am Richard, also known as theSignalyst.
I find the SUSHI 🍣 daily chart intriguing , as it seems to be following the classic Wyckoff Cycle 📈.
If history repeats itself, we’ve just broken out of the accumulation phase ✅, highlighted in green 🟩.
As long as the bulls 🐂 remain in control, the markup phase may have just begun—potentially pushing SUSHI as high as $2.5 🚀.
❓ What's next?
Will SUSHI continue to trade higher from here, or will this cycle play out differently?
I hope you find this post useful, and I would appreciate your likes and support.
Which scenario do you think is more likely to happen first? and why?
📚 Always follow your trading plan regarding entry, risk management, and trade management.
Good luck!
All Strategies Are Good; If Managed Properly!
~Richard
