75% Profit with SUSHISuch a WOW! 75% profit in Sushi
TP1: 1.07 ✅
TP1: 1.11 ✅
TP1: 1.16 ✅
TP1: 1.22 ✅
TP1: 1.3 ✅
1.07 (8.65%;3X), 1.11 (20.19%;3x), 1.16 (34.62%;3x), 1.22 (51.92%;3x), 1.3 (75;3x) 😍👍
1.07 (5.77%;2X), 1.11 (13.46%;2x), 1.16 (23.08%;2x), 1.22 (34.62%;2x), 1.3 (50;2x) 😍👍
1.07 (2.88%;1X), 1.11 (6.73%;1x), 1.16 (11.54%;1x), 1.22 (17.31%;1x), 1.3 (25;1x) 😍👍
See my previous idea!
Follow me! Copy my trades!
TradeSetup_Reza
SUSHIUSDT trade ideas

SUSHIUSDT 1w Long ANALYSIS CHECK POINTHi friends, is your day going well?
SUSHIUSDT looks like it's going to go up high, but look at my point of view
It is judged that it is collecting long supplies in the retest after breaking the falling edge upward.

SUSHI - Huge breakout! A new uptrend is starting right now!
Great news for the SUSHI altcoin, because the descending parallel channel is currently breaking out with an elevated volume!
Congratulations to the bulls for this success, and SUSHI is now completely free to go up to my profit target.
Take profit at the 0.618 FIB + strong horizontal resistance, which is between 5.289 - 5.890 USDT. This is an extremely strong resistance, so you want to take profit here at all cost!
According to my Elliott Wave analysis, a huge impulse wave has been completed, so there is an amazing opportunity for a massive pump in the immediate short-term.
As you can clearly see, the last bullish candle looks like a dildo, which you really want to see!
I believe this coin can pump extremely hard. But there is also a possibility of a slow uptrend. Let's see what is going to happen.
It's definitely a tremendous opportunity right here right now for the SUSHI coin, so do not waste any time and do your own research or just press the BUY button!
I expect massive gains for selected altcoins. You can find them in the related section down below.
For more analysis, hit "Like" and "Follow"!

SUSHI pumped 13%. What's next?Hello, dear TradingView members.
This is a SUSHI idea.
SUSHI pumped about 16% today and made it to the top gainers' list.
Right now, it is rejected by the upper Bollinger Band and the local resistance area.
The resistance level on the chart is substantial since it used to be SUSHI's support level for a long while.
Two support levels are on the way down, holding the price up for now.
Scenario One:
The price will consolidate sideways near support and back up to retest the resistance levels.
Scenario Two:
The price move near the resistance level and gets rejected down on lower support levels.
RSI is oversold, and the price has more room to go down.
Now let's see your ideas. Let's have a discussion.
Let me know if you guys have any questions;
I will be more than happy to help.
Good luck, and thank you.

SUSHI short position ❌🧨Hello 🐋
Based on the chart, the price is close to the resistance zone and resistance area ✔️👌
if
the price doesn't break the resistance zone to the upside, we will see more correction to the downside ❌🧨
Please, feel free to share your point of view, write it in the comments below, thanks 🐋

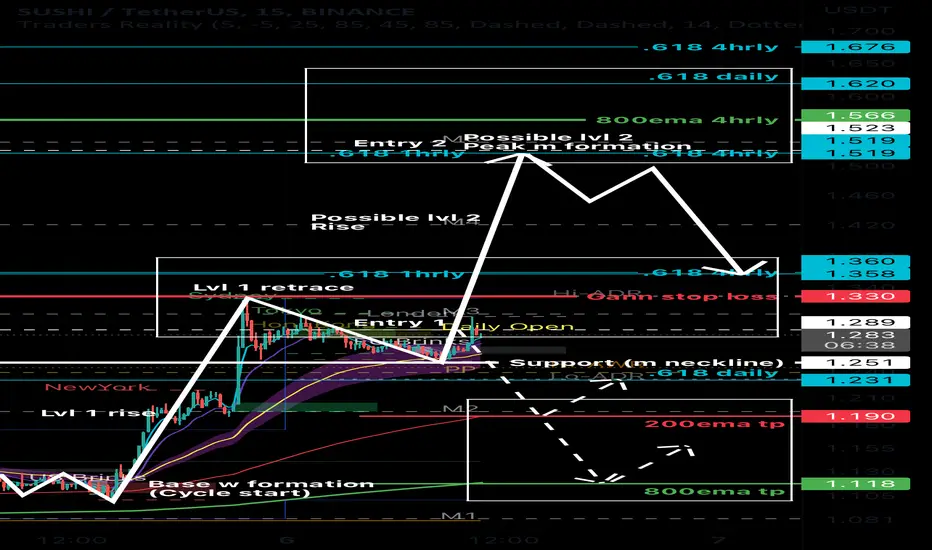
SUSHI - Potential SHORT -15MIN/1HR - Binance for BINANCE:SUSHIUSTrade Status: ACTIVE
Trader: Drizzzled (AUS)
Trade Type: SHORT
(RE-ENTRY/DCA ABOVE previous entry post)
Entry 1: 1.289 (entry 1 box options)
-if missed focus on next entries. Don’t stress.
Entry 2: 1.523 “”
Entry 3:
Entry 4:
Entry 5:
Entry 6:
Entry 7:
Stop Loss:
Entry 1: Gann resistance - 1.330 (entry 1 only)
-5-10% move from your chosen entry 1
-slightly above/below entry/key resistance
-1:1 or to own personal risk factor
Entry 2: “”
Entry 3:
Take Profit Targets:
- (50ema tp)
-1.190 (200ema tp)
-1.523 (800ema tp)
-
-
Comments:
-move stop loss to break even once target 1 is hit. DCA entries above/below if stop loss is hit.
-emas will rise/drop with time so shift tp accordingly. If we re-enter higher/lower our same emas become our take profits. Also i have put boxes around key supports which I may choose to take earlier or later profits at too.
-by all means you can long from the daily open to these higher target ‘short’ entries.
-you don’t have to enter at ‘entry 1’ if you would rather enter higher.
-level 1,2 or 3 ,pumps/moves, can go higher and create new levels, hence the re-entries. It’s a shorter time frame strategy.

SUSHIThe price has broken one of the downtrend lines and the daily 50 MA/EMA and 100 MA. Above are 2 strong resistances - another trend line and a daily 100 EMA. A lot of bearish divergences have formed. Support and resistance levels indicated

Institutions are positioning Run with the big dogs
why not pick up pennies behind a steam roller
Full retrace
Sets up Parameters and makes it easy to Trade

Sushi/USDT Long📈Trading proposals post based on price action,
technical analysis, major intraday supports
and resistances, rejections, breakouts, chart
patterns and other factors.
How this analysis was done:
First I find usdt pairs using crypto screener then if all Three×3 in 1 indicators gives main entry confirmation at the same time I go with the analysis then I find Support and Resistance zones in 3x entry timeframe also using one of the three indicators for backing up my analysis and filter bad signals then I also make trendlines using two of the 3 indicators in 3x entry timeframe for filter out more bad signals then again using one of the 3in1 indicators I filter fake breakout in entry timeframe and in higher time frame and then if other minor conditions is confirmed the analysis is done.
Take Profit:
Take profit is A/B/C Zone point
Take profit is dynamic/trailing stop loss/take profit
Stoploss:
Stoploss is above/below the D Zone point / danger line
Trading and investment in the financial
markets always involves high risk, So In order
to succeed using our signals make sure you
have learned the essential skills for money and
risk management
To SUPPORT this channel, please press the
LIKE button, COMMENT and Share with your
friends


SUSHI - Spicy Combo Long playOkay in all seriousness , my thoughts on SUSHI if we push higher on the chart. Short-term target and of course larger resistance/supply above to get past.
Must hold this key S/R that is currently seemingly being flipped, for now.
V

Sushi great risk/reward spot positionthis is more of mid term play rather than a day trading position.
i am setting orders to buy SUSHI between 1$ and 1.03$ and i plan on keeping it for a at least a few days and that is why i am going to make a spot position and not a leveraged futures position.
i will hold it even if it goes a little under.
technicallly it is time for sushi but also news are coming on the 26th.
also,if the third tap on the support is met,that is huge signal for a mid term buy.
i will keep it at least until price meets the red descending line of resistance or the resistance at 1.17
basically we want it to drop short term so we can buy,and then we need a slow and steady pump.
orange lines are resistance points in case you want to get out sooner.


SUSHI usdt is one of my favoritesi will set an order to go long on sushi at 1.022$ at x3 leverage.
If this order is filled,i will set 3 take profit orders
1.067 4.5% (13.5%)
1.095 7.1% (21.3%)
1.124 10% (30%)
I will cut losses if 4Hour candle closes below 0.995
(i will update here)
This idea is supported by technical analysis
and this week Sushi will announce a new CEO.
also,for the time being BTC will probably bounce around 22k which means most alts will bounce as well
FOLLOW FOR MORE

SUSHI is in Demand zoneThis is another great 5-7x potential here and more
I doubt the bear market will be over till the next year, but if we get a good rally into EOY, I will be exiting at the targets mentioned on the chart (look for the green arrows).
Also i doe expect BTC to slice below $10k at some point next year
At the mean time all coins are staked and making some interest.

Sushi is good for LongSushiSwap (SUSHI) is an example of an automated market maker (AMM). An increasingly popular tool among cryptocurrency users, AMMs are decentralized exchanges which use smart contracts to create markets for any given pair of tokens.
SushiSwap launched in September 2020 as a fork of Uniswap, the AMM which has become synonymous with the decentralized finance (DeFi) movement and associated trading boom in DeFi tokens.
SushiSwap aims to diversify the AMM market and also add additional features not previously present on Uniswap, such as increased rewards for network participants via its in-house token, SUSHI.
Buy setup
Entry : 0.90 - 1.04
SL : 0.775
TP1: 1.07
TP1: 1.11
TP1: 1.16
TP1: 1.22
TP1: 1.3
TP1: 1.4
TP1: 1.55
TP1: 1.7
TP1: 1.9
TP1: 2.1
TP1: 2.35
TP1: 2.7
TP1: 3.1
TP1: 3.6
TP1: 4.1
TP1: 4.9
Spot or Future (1x, 2x, or 3x)
Run and keep it enjoy!
Follow me! Copy my trade! :)
TradeSetup_Reza

Sushi.Usdt (Y22,P3.Video1).Macro and its current statusHi All,
Another workshopped video looking at how to identify key levels, and hence how to trade this and why it makes sense.
I'm in it for the trade, not to hodl.
Please give me a like and share.
All the best,
S.SAri

Sushi good accumalation levelaccumalating sushi at these levels
great risk to reward here if we can break the downtrend

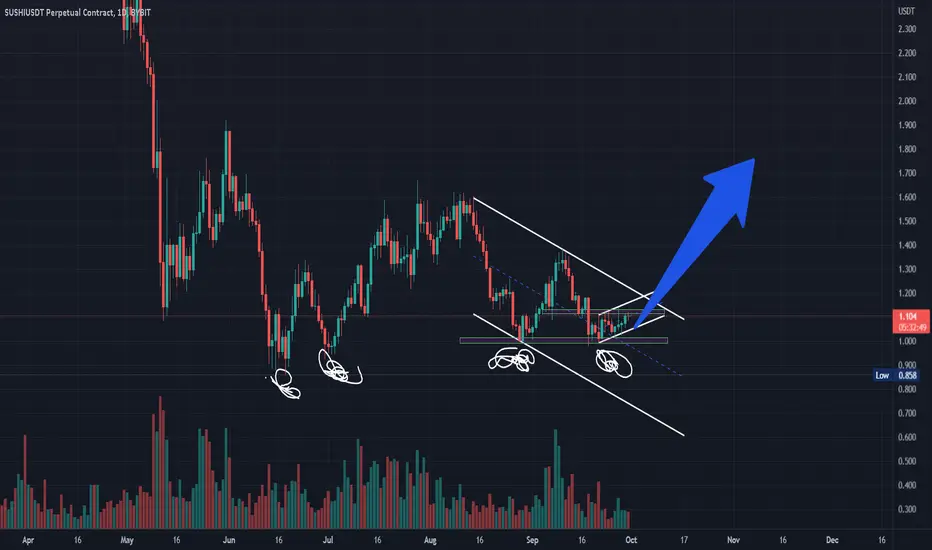
SUSHIUSDT | RANGE BREAKSSUSHIUSDT has been trading with in range, The price recently break above the range. The bulls need to hold the price above the broken range.
The bulls are in control.
Tarde your levels accordingly.

SUSHIUSDTPERP 091122I'm bearish short term for SUSHI until it mitigate the demand zones below the liquidity.

SUSHI/USDT Distribution PhaseWyckoff Dist Phase ,
SUSHI/USDT
Using SMC+Wyckoff. Seems to be a good trade , taking a long from there , right after it shorting from that OB.
Good luck whoever wants
