SUSHI - WHAT?Hey Guys, SUSHI looks like it will outperform BTC. Looks super strong! I`m in with a little trade, but HIGH RISK!!!! Maybe better Spot!
NO FINANCIAL ADVICE | HAPPY TRADING | DYOR | JUST MY THOUGHTS
SUSHIUSDT trade ideas

A buy position for sushiWe expect the price to reach the resistance level and fall there , If you see a reversal pattern, you can take a sell position at the resistance level

SUSHI is ready to fly 🚀Hello traders 🐺 .
in today idea , I want to talk about SUSHI chart and have quick look at the future perspective of the SUSHI price and see what gonna happen for the SUSHI , so make sure that reading this idea until to the end 👇 :
As you can see in the chart above , we have a very big falling wedge pattern which is a bullish pattern and the target of this pattern is the top of the wedge , in this case target is near to the all time high price .
Also I found some interesting fact in the chart so I decided to share them with you :
First of all let's start with the RSI :
In the chart above we can see that the RSI is also is in the same pattern just like a price and the interesting fact is that , RSI had never been as low as the current level around the oversold territory which could indicate that SUSHI found the bottom , and it's time to break above .
the second one is MACD :
In the MACD we have 2 important sign :
(A) _ MACD line is crossing above the signal line which usually consider as a buy signal
(B) _ we have a very clear bullish divergence between the MACD and the price
This two sign together could showing us a very strong buy signal
third one is stochastic :
about the stochastic we can see that a buy signal and more importantly if you look back into the history of the price , every time that stochastic was around the current level and flashed a buy signal we saw a nice bullish impulse in the price .
I hope you enjoyed this idea , Also if you are interested in my ideas make sure to follow me and share my ideas among your friends ; thank you for reading my idea 🙏🐺 .

sushi usdt daily chart sushi usdt daily chart
falling wedge break from upside and price reach the monthly pivot and if sushi break this pivot , it can continue upward
2 different idea shown by red and green arrow
also its depend on btc so before taking financial Decision attention btc

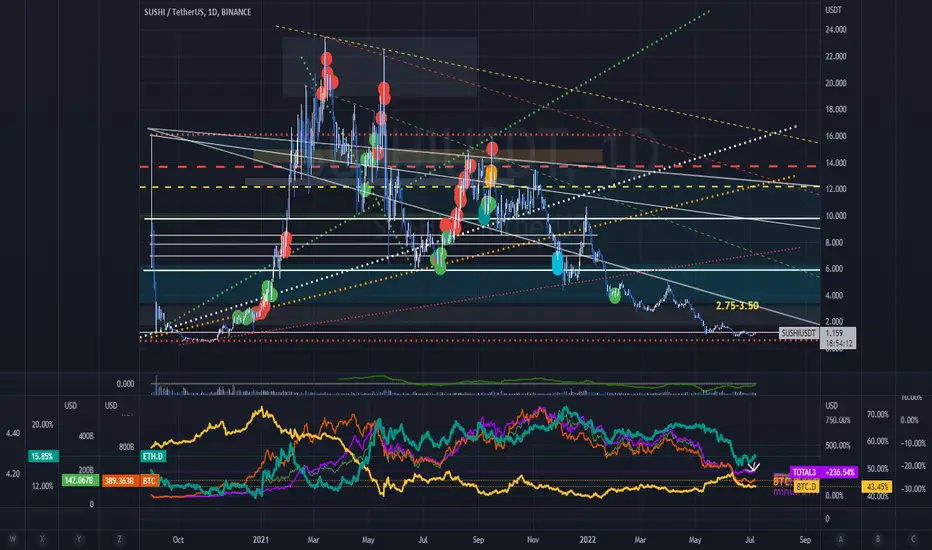
sushi under 1.00/1.25 even 1.50 is a buy n forget at the least1.75/1.85 is the first of what you could call resistance with the real first target of 2.75/2.85 or in other words Sushi under or close to 1usd is redonkuless and a def scoop and forget. We have utility and liquidity with an actual team running this project. at this point Uniswap is almost to mainstream as far as Dexs go or decentralized exchanges and I worry a major target for USA etc regulations and ruthless acquisition attempts to hold majority tokens in pools and eventually the asset it self as a whole. anyway road this b!tch to 20usd from about here last time so lets go. cosmos integration with cross chain movement options and hopefully continue to build out new exit and on ramps for fiat into and off crypto
SUSHI - Delicious! 😤Reasons to take long:
⭐️ BTC needs a pullback
⭐️ Level is 8 days long
⭐️ Level is clean
⭐️ Price is squeezing to the level
⭐️ Pullbacks are getting smaller
⭐️ 3rd touch
⭐️ 50 ATR
⭐️ Over VWAP
Will enter when price squeezes to the level on 5m timeframe, the base will form and the tape will get faster.
If you don't understand the previous sentence, just use swing stop-loss 3-5%
Fix profit by parts:
1% - 1/3
2% - 1/3, stoploss to breakeven
What's left, hold to the maximum
What do you think of this idea? What is your opinion? Share it in the comments📄🖌
If you like the idea, please give it a like. This is the best "Thank you!" for the author 😊
P.S. Always do your own analysis before a trade. Put a stop loss. Fix profit in parts. Withdraw profits in fiat and reward yourself and your loved ones

Sushi/USDT long📈Previous important support and resistance zones:
*s1: 0.920
*s2: 1.113
*r1: 1.298
Conditions for long:
1.break of trend line
2.break of descending triangle breakout
3.break from momentum indicator trendline
4.resistance from the previous *s1: 0.920 zone
5.volatility increased
6.Money flow index turned green from red
7.di+ is above the di-
8.adx line is above the 20 level
Stoploss:
1.below the previous *s1: 0.920 zone
Take profit:
1.I like to trail the take profit but *s2: 1.113 zone can be next take profit because it was previous support zone then turned into a resistance zone

SUSHI-USDT Watch your bag.This is not a financial advise -
I expect a downside for SUSHI and the potential target is
- 0.18 $USD and it may drop further, So be careful
Patience is the key this charts is for the upcoming weeks/Months.
Regards,


SUSHI prepare for more downLook in small TF for a entry short on Sushi, now is sitting under resistance for retest, Daily close will confirm the move, if breakup invalidation,

SUSHI breaks its long term trendlineSUSHI is breaking its trendline since May 2021 and promises a big rally.

SUSHIUSDTSUSHIUSDT Over the past period, the price has been in a downtrend. At the level of the strong support zone There may be a correction If the price does not break through the 0.857 support, there is a possibility of a reversal.
Waiting to buy the red zone, the first target 4.596 >> GooD Luck 😊

SUSHI/USDT Time to re-buy Good morning everyone,
We are back at SUSHI coin. From the previous times we made +44% and we think it is good to re-buy that coin. We are buying this coin between $0.85-$1.05. Targeting mainly $1.7 but in a long term $3.5-$5.
Stop is necessary and we are setting it if daily closes below $0.84
If you like ideas provided by our team you can show us your support by liking and commenting.
Yours Sincerely,
Swallow Team
Disclamer:
We are not financial advisors. The content that we share on this website are for educational purposes and are our own personal opinions.

SushiSwap (SUSHI) formed bullish Gartley for upto 4000% big moveHi dear friends, hope you are well and welcome to the new trade setup of SushiSwap ( SUSHI ).
On a monthly time frame chart, SUSHI has formed a big bullish Gartley pattern.
Note: Above idea is for educational purpose only. It is advised to diversify and strictly follow the stop loss, and don't get stuck with trade.

sushi 3d bull divsushi also looks great on HTF.
3d bull div working on validation. will likely look for longs if we get a pullback/retest.

SUSHI is oversold, Recovery begins at $10$SUSHI is oversold at this moment. From December 2021 SUSHI has been in decline from $10. But A/D showed a price divergence in the bullish direction. Price trend declined more against what was to be expected. But from then to now price support could still be at $10 and SUSHI could be proven to be oversold at price $1.2 as of June 6 2022.

Sushi vs USD - Bullish divergenceOn the above 1-day chart there is a 94% correction since the beginning of August and following oversold condition (orange bar). There is now increasing signs a reversal may be imminent. What signs?
1) Regular bullish divergence. All three oscillators are printing higher lows with lower lows in price action over a period of 30 days.
2) The last candle printed on the weekly chart (below) closed higher with a long wick to the downside indicating there were many buyers at this level. Risk / reward is excellent.
1st target $1.26 / 100% gain

SushiSwap SUSHI Entry Range, Take Profit and Stop LossSUSHI /USDT
Entry Range: $1.00 - 1.20
Price Target 1: $1.75
Price Target 2: $2.65
Price Target 3: $4.40
Stop Loss: $0.85

SUSHI, near the downtrend line.The following are machine translations:
In the 4-hour chart, another period of decline began on June 1, and a downward trend line was formed on the way down, which was supported near 0.9. In the sideways fluctuation, it has now reached the vicinity of the downward trend and has been significantly suppressed.
The indicator macd energy column is running above the zero axis, with a bullish trend, the fast and slow line is about to go up to the zero axis, if it goes up completely to the zero axis, there is a high probability that it will break through the downtrend line. The RSI indicator is trending up above the neutral 50, which is bullish.
In terms of operation, if it breaks through the downtrend line to do long, there will be a period of rebound, and if it fails to break through, it may continue to oscillate within the range of the support line and the downtrend line.

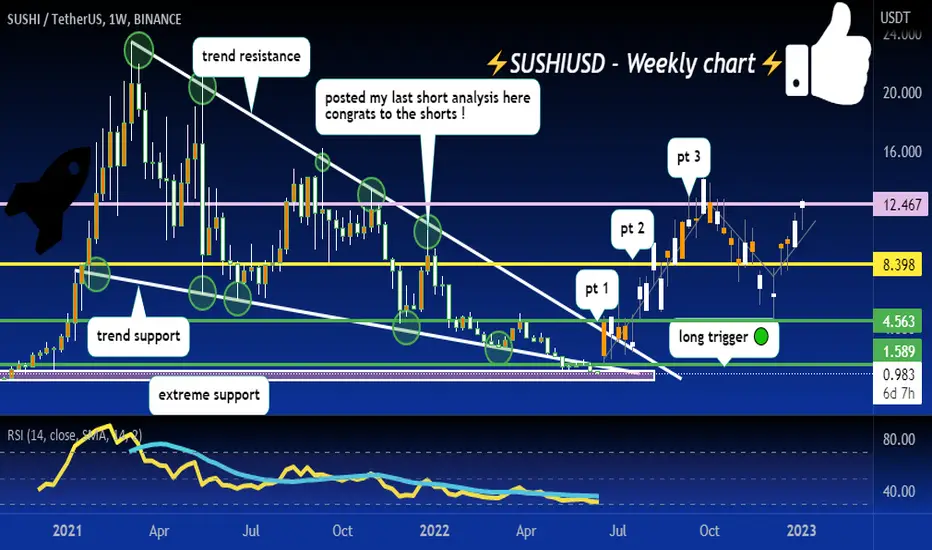
crazy move to downside since my last short analysis at 10! 🥶SUSHI now at a extreme support and near strong trend supports, watching for clear break past 1.589 before taking a long, once this breaks we can target 4.56-8.39-12.46
longthis project is great if u want to holdle for long time and make crazy profit this project is for u from now to two years

Sushi Short Plan R/R 2We have only a Short Scenario because of Price Movements in the Last few Days.
So we need a bearish confirmation under the Redbox to set up our short position on it after that.
Stick to the Plan & Save 50% on 1st TP ( or Make it Risk-Free )

