SUSHIUSDT - Long - Potential 46.04%SUSHIUSDT - Long - Potential 46.04%
Exchanges: Bittrex, Huobi.pro, KuCoin, FTX, Binance
Signal Type: Regular (Long)
Entry Zone:
8.074 - 8.441
Take-Profit Targets:
1) 8.812
2) 10.534
3) 12.284
Stop Targets:
1) 6.679
Entry Triggers- Nice bounce on EMA50 / EMA20 support with bullish future pivot an exhaustion reversal. BTC dominance in steep decline.
SUSHIUSDT trade ideas

SushiusdtAdding sushi at 0.618, 0.66 fib , not using stop loss though, as I don't wanna get stopped on this one.

SUSHI long DCA ideaSushi is currently having a pullback. Looking to DCA into SUSHI to ride the next rally.
SUSHI / USDT
ENTRY : 8.238 - 7.475 - 6.725 - 5.633 (Put 4 different orders on each level)
TP : 9.150 - 10.000 - 11.500 - 13.150 - 16.100 - 19.350 - 21.500 - 28.500
NO SL. SPOT TRADE.
Enjoy ;)


SUSHI-USDT PREPETUALkeep an eye on 9.43, if it Breaks and waits for the confirmation candle, then Enter a LONG POSITION with 10X.
Not a Financial Advice.

nonononononononononongbfmbkfmbvlrfmbrnononononononononongbfmbkfmbvlrfmbrnononononononononongbfmbkfmbvlrfmbrnononononononononongbfmbkfmbvlrfmbrnononononononononongbfmbkfmbvlrfmbrnononononononononongbfmbkfmbvlrfmbrnononononononononongbfmbkfmbvlrfmbrnononononononononongbfmbkfmbvlrfmbrnononononononononongbfmbkfmbvlrfmbrnononononononononongbfmbkfmbvlrfmbrnononononononononongbfmbkfmbvlrfmbrnononononononononongbfmbkfmbvlrfmbrnononononononononongbfmbkfmbvlrfmbrnononononononononongbfmbkfmbvlrfmbrnononononononononongbfmbkfmbvlrfmbrnononononononononongbfmbkfmbvlrfmbrnononononononononongbfmbkfmbvlrfmbrnononononononononongbfmbkfmbvlrfmbrnononononononononongbfmbkfmbvlrfmbrnononononononononongbfmbkfmbvlrfmbrnononononononononongbfmbkfmbvlrfmbrnononononononononongbfmbkfmbvlrfmbrnononononononononongbfmbkfmbvlrfmbrnononononononononongbfmbkfmbvlrfmbrnononononononononongbfmbkfmbvlrfmbrnononononononononongbfmbkfmbvlrfmbr

sushiusdt buy and hold for short term sushi is in a good position and there is a lot of volumes expected in the short term sushi will fly buy and sell targets are on chart buy as per mention and hold for all targets
if you like my idea please like and share


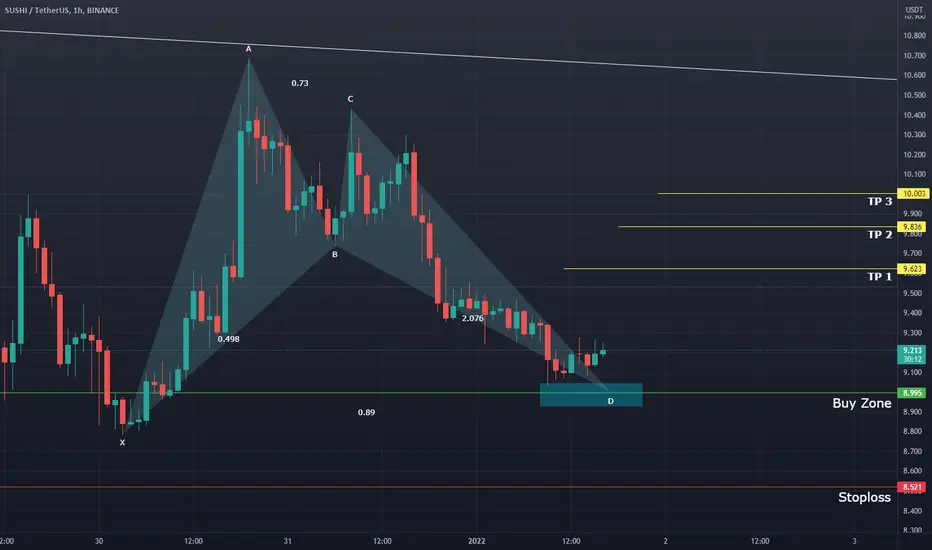
Sushiusdt This is what I think for sushi , although after the 5 waves down we can get a abc .
0.382. ($8.54)
0.5. ($7.881)
0.618. ($7.22)
0.66. ($6.987)
Gotta see the reaction at these levels
There is opportunities to long , then short.
But too busy will wait to spot buy .
Merry Christmas to everyone

sushi backtestnot financial advice just my backtest
use stoplose if you want to try
have a nice day!

Sushi/usdtSushi/usdt
4 hour time frame
formed bullish Bat pattern
in 4 hour RSI bullish
in daily time frame rsi is bearish
we can see upward for short time frame
Dyor
NFA
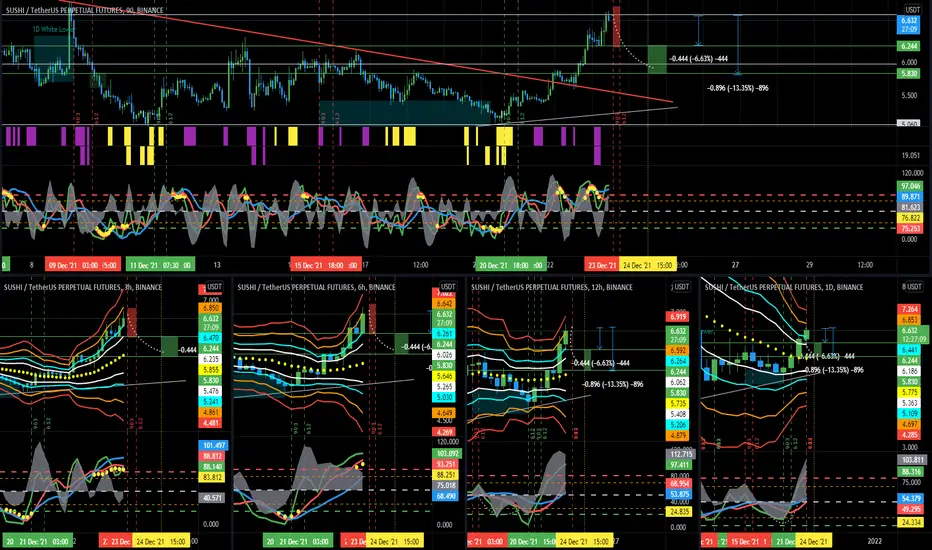
SUSHI LTF 4h correction?Seems like the bearish divergence on 4h chart is playing out.
The EMA 21 support did not hold.
Overall SUSHI did 100% with little to no correction so I think 30% corrective move is healthy with making HL and continuing with the uptrend.
If we do not make HL and make LL instead or lose $7.5-$8 support, there is a high chance we are gonna revisit the HTF range low (around $6) --> Check out my related idea on why was sushi currently pumping from the HTF pov.

SUSHIWe have two scenarios here . Follow me on Trading View because I will surprise you. BY THE WAY SUSHI ENTER TO METAVERSE FEILD!!!

SushiAs we see it's time to long on Sushi its on critical area and broke its 1H trend line as i draw on chart(white line) and its finishing pullback then go up to TP1 , you should keep SL so tight because of powerful daily downtrend line( Red line ).

SUSHI - A pullback to 6.121 - $5.830Hi, iJustCoiners!
We are on the verge of seeing an exhaustion of this current move up.
Price hit upper Red/Orange Bbands on 12H and 1D.
We may expect a pullback to the White Upper Bband/Yellow Basis price zone at 12H timeframe.
My "assistant" indicators are both PURPLE which is a signal of a potential top.
I'll we waiting for an entry lower-timeframes.
Have a nice day!
And remebmer: "This market doesn't respect doubters"!

interesting setup here, nuetral at the momentsushi sitting right below this downtrend resistance, also some local resistance resistance zones here.. this is what we call a cluster resistance!
if it breaks above 11.03 we can fly to 16.24 resistance, below 9.69 we can test 5.65.
like and follow for more 💘

SUSHI could deliver fireworksOne last thing for this year: SUSHI might deliver fireworks if it can get past resistance. Next stop would be 13.5

Sushi pumping, why?HTF perspective --> sushi hits range low --> pumps towards mid range or range high
It is still in the huge downtrend, so far playing the range --> 3 possible scenarios ?
IMO we hit the mid range, after that, keep an eye for a while to decide which direction we go

SUSHI ANALYSISHere quick look
Sushi made a 10.6$ high and now coming back .
It having a support zone 8.8$ and 7.97$ from there sus hi bounce to 12.370$,14.266$ targets
All we need to break a descending triangle
thank you

Sushi waiting till the new yearSushi looking for a price of 10.41 on January 4 before making a move on outer edge of that gain circle around 12:24 on January 6/22....... on the 144m chart
