sushiusdtThis is what I expect for sushi, sorry a bit messy but haven't got the software for elliott waves too expensive haha . Short term short.
SUSHIUSDT trade ideas


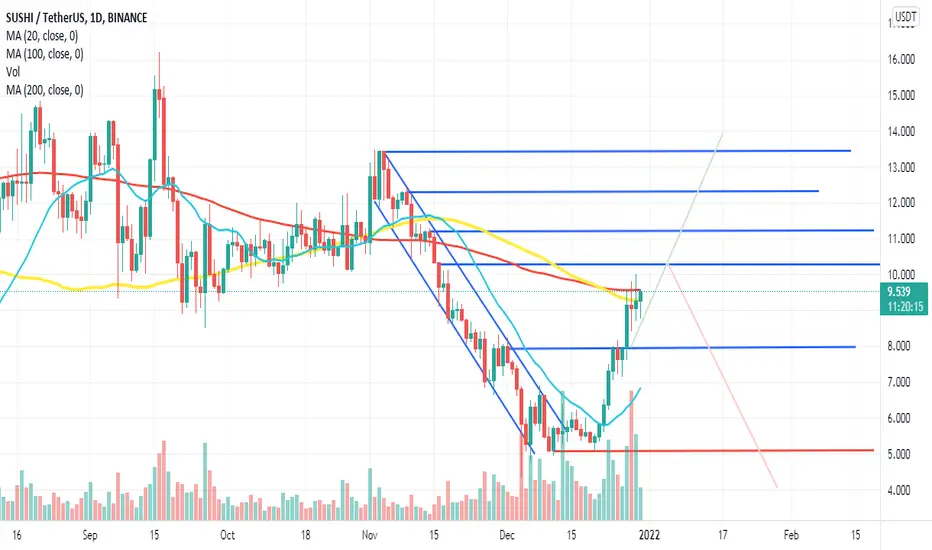
$SUSHI, UCTS printed a 1D Buy signal while testing ~7.2$ area $SUSHI /USD
UCTS printed a 1D Buy signal while testing ~7.2$ area that I identify as a resistance
Volume also looking strong, lets see if it can show continuation..
If manage to hodl/flip, then looking to ~8.6$ as next important level to watch
#SUSHI

SUSHI/USDTSUSHI moving in a big descending channel (and a BIG Bull Flag) with a chance to breakout.
weekly MACD preparing to cross, but at same time chart tells us about forming bear divergence on weekly TF.
daily MACD and RSI on high level and signaling about price reversal.
You can long SUSHI with high risk at current price with short-term targets at 11 and 13 USDT level.
But best solution is to wait for the price drop and open longs at demand zone
Short-term target — 11, 13 USDT
Long-term targets — 22, 36, 58, 90 USDT


Sushi Bearish, Double Top 1 hr (potential 6)Hello, the overall crypto market is bearish. Many coins are down. BTC is 47k now. However, sushi reached 9.8 dollars today(normally, it has a good correlation with BTC performance). On 1 hour chart, it has reached a double top at around 9.8. Now, it is has some downward pressure now. Stoch RSI reached the overbought region and actually back below 80 (negative divergence). If overall crypto mkt stays bearish, there is a great chance, sushi will go down to first target price around 7.8, which is the top of the previous channel. If selling pressure strong enough and goes below 7.8, the next target would be 6 ( this is the bottom of the previous channel and also we see a support around 6 as well. Not financial advice.

SushiSwap (SUSHI) Aggressively Moving Up To Breakout Big WedgeHi friends hope you are well and welcome to the new update on SushiSwap (SUSHI).
Bounced from the support of big wedge:
Sushi is moving in a big falling wedge pattern on the weekly time frame and recently it has bounced by the support of this wedge. Right now the priceline is also breaking out EMA 21 on the weekly time frame. Once it will be broken out then there will be a high probability for the breakout of the resistance of wedge.
Big Gartley:
In Nov 2021, Sushi also formed a harmonic bullish reversal Gartley pattern which I shared on the 29th of Nov. This harmonic bullish reversal move can be very supportive for the big breakout from the wedge as well.
Note: Above idea is for educational purpose only. It is advised to diversify and strictly follow the stop loss, and don't get stuck with trade

SUSHIUSDT-SHORTThere is a short position in SUSHIUSDT Sushi
SUSHIUSDT Sushi
🔴Short Now or set on Key Level 9.830
🟢Target 1 8.630
🟢Target 2 7.770
❌Stop loss 10.260
#K_Level
Please support our activity with your likes and comments.

SUSHI SWAP Daily TA : 12.29.21 : $SUSHIAs we can see, if the price can break this important range of X-Point resistance, we can expect growth to the levels indicated on the chart.
Follow our other analysis & Feel free to ask any questions you have, we are here to help.
⚠️ This Analysis will be updated ...
👤 Arman Shaban : @ArmanShabanTrading
📅 29.DEC.2021
⚠️(DYOR)
❤️ If you apperciate my work , Please like and comment , It Keeps me motivated to do better ❤️

SUSHI/USDT ChartHi, I try to post often so if you could follow, like and comment your thoughts it would mean a lot.
SUSHI had a good run in the past week, and after having a run from the 5.10$ range to 10$ today I think that the coin will have a correction now.
In the 4H chart we can see a bearish divergence showing up recently so we have a very nice short set-up in the short/mid term. I can't speak about the long term but in the short term I'm preety sure that we will have a correction. A good target would be around the 8.50$ support.
Another bearish factor for altcoins is the fact that BTC just brokedown the 48K zone and the market isn't showing that strenght and confirmation that we need to resume the BTC uptrend. Thanks for your attention and good luck on your trades.

SUSHIUSD 1W - Huge BullFlag Target $26Hi everyone,
Thank you for considering reading my idea.
SUSHI bounced off the 0.786 level of the Green Fibonacci Retracement around $5. Right now, the price is at $9. That's almost 100% increase in just 2 weeks. The bull flag formed has a target of around $26. It's around 1.272 and 1.414 level of the Yellow Fibonacci Retracement. There is a potential 186% increase from the current price. NFA
Like this idea and follow me for more analysis like this. TAYOR.
Cheers,
Juvs

$69 is coming in the 1st wavecrab harmonic pattern:
X=$271
AB=0.61 XA
BC=0.38 AB
*1.6 BC=$69.2
0.78 XA=$69.5
0.88 XA=$131.5
2 BC=$133.6
2.24 BC=$201
*2.6 BC=$387
1.13 XA=$622
1.27 XA=$1538
*3.6 BC=$2163
1.41 XA=$3705
4.23 BC=$6265
*1.6 XA=$13943

SushiUSDT Prediction Here is two scenario for Sushi...
If any candle close under 4.5 the scenarios will be failed.

SUSHI mooningHey Trader,
please see my current idea on the Sushi Crypto, where my count suggest that we are done with wave 1 and 2 which would now lead to a wave 3 extension to either 1.618 (which is equal to target 1) or to 2.618 (which is equal to target 2).
Let me know your thought.
RT

SushiSwap (SUSHI) Buy ZoneSushiSwap (SUSHI) Buy Zone
--------------------
BIAS
Mid-Term : Bullish
SUSHI formed bull flag in 1 day time frame and currently retesting below it and we might see a further drop toward the marked support level which is around $5.3
--------------------
$SUSHI/USDT SPOT SETUP
Entry Price : 5.05 - 5.4
TP 1 : 5.63
TP 2 : 5.98
TP 3 : 6.8
TP 4 : 7.184
TP 5 : 8.07
TP 6 : 8.482
TP 7 : 9.174
Stop Loss : 4.321
*Stop Loss - SUSHI daily close below 4.321
*Maximum 5% of Portfolio.
*Whenever TP 2 hits, Move stop loss to entry.
--------------------

Sushi - #sushi $sushidear friends
this is possible for this coin.
I think it'll have a pullback and then go up.
check for lower prices to enter.

SUSHI/USDT: BullishHello everyone
This analysis is my personal opinion ,not a financial advice ,so do your own research.

Sushi Can Grow 150%+ vs TetherWe can see the classic "cup pattern" on the SUSHIUSDT chart, this can signal that the trend is about to reverse.
As you can see on the left side, each time this bottom pattern shows up prices tend to grow.
We also have a broken downtrend as we all as increasing volume and bullish indicators (strong RSI).
All these signals support higher prices.
Note: There can be a retrace before higher prices as it happens with the cup & handle pattern.
The targets are marked on the chart.
This is not financial advice.
Namaste.

SUSHIUSDT is creating a pennantSUSHIUSDT is creating a pennant below the weekly resistance.
We need to watch two key levels and wait for the breakout, According to Plancton's strategy (check our Academy ), we can set a nice order
–––––
Follow the Shrimp 🦐
Keep in mind.
🟣 Purple structure -> Monthly structure.
🔴 Red structure -> Weekly structure.
🔵 Blue structure -> Daily structure.
🟡 Yellow structure -> 4h structure.
⚫️ Black structure -> <4h structure.

sushi/usdt breakout sushi/usdt broke out the downward trendline
and taking retest at the support level
#dyor

SUSHI - is going to break this trendline 👀SUSHI has been in a local downtrend for a long time. We now see the price in a trading range between $5 and $6.3 levels. It is very likely that big players are accumulating their positions here. The large volume at the bottom signals this as well. A breakdown of the trend line could be a good buying opportunity. In case the big value area is broken, there could be a trend reversal.
Write in the comments all your questions and instruments analysis of which you want to see.
Friends, push the like button, write a comment, and share with your mates - that would be the best THANK YOU.
P.S. I personally will open entry if the price will show it according to my strategy.
Always make your analysis before a trade.

Sushi Looking sexy. Need to pop and hold above 8.30 but it’s above all of my indicator reisatnce which is really somthing that could cause a HUgE run in the next few weeks and months fo sushi. Somehinf hige is on the horizon
