[Deep Dive] SUSHI – Edition 3: Accumulate. Anticipate. Accelerat🧠 Cycle Anatomy: What the Chart Is Telling Us
📉 Phase 1: Markdown
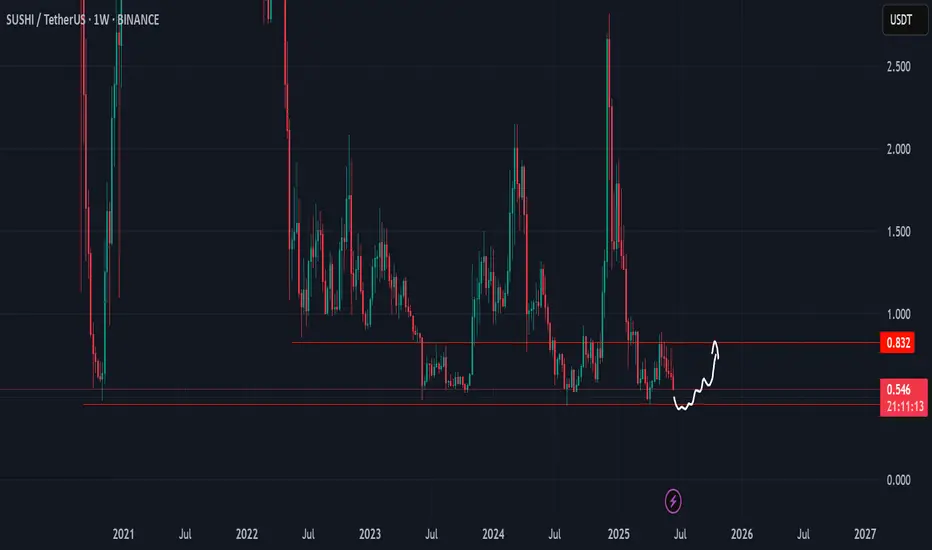
The bears dominated, slicing price downward into key historical support around the $0.50 mark — the same level that anchored the previous accumulation zone.
📦 Phase 2: Accumulation
Both accumulation phases (mid-2023 and Q2 2025
Related pairs

SUSHIUSDT at a Critical Pivot Golden Pocket Retest or Bull Trap?📊 Full Daily Chart Analysis (1D) — KuCoin
After months of dull sideways movement, SUSHI is finally showing signs of life! A strong breakout above a long-term consolidation range has pushed price up to the key resistance at $1.03, raising the possibility of a mid-term trend reversal.
However, the p

SUSHI LONG TERM POSITIONGoing to be entering at the .618 Fib level (Golden Pocket) for a long position.
ETH has been pumping, this money will start rotating soon enough and i'm betting sushi swap will get a nice pump in the upcoming weeks...

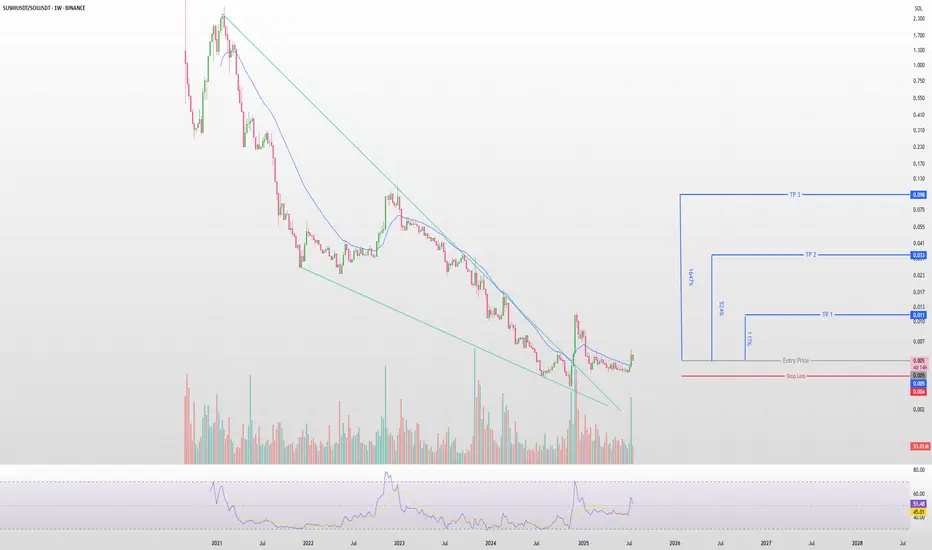
SushiSwap Ready to Serve a 1671% Move against Solana? SUSHI/SOLUSDT Weekly | Falling Wedge Breakout + High R/R Setup
After a multi-year downtrend, SUSHI has finally broken out of a large falling wedge — a classic reversal pattern. This is the first real structural breakout against SOL in over 3 years, and the volume spike confirms strong buyer intere
SUSHI Nice Structure, Keep in WatchlistSushi has nice price structure
0.4 is good buying opportunity
Massive Upside for SUSHI from Key Demand Zone!CRYPTOCAP:SUSHI is bouncing strongly from a key multi-tested weekly support zone (~$0.42–$0.55), signaling a potential bottom formation. Price action shows a bullish structure with the possibility of a trend reversal. If momentum continues, we could see a rally first toward Resistance 1 at $1.25, f

SUSHI LONG POSITION (LONG TERM)Long term sushi trade, entered at this area, I think that a break out is going to happen any day.
TP region is around $3-5
Going in with a lot more size on this one 2-8 Week timeframe on this.

SUSHIUSDT Forming Descending ChannelSUSHIUSDT is currently forming a classic descending channel pattern, a setup that often precedes strong bullish breakouts once price action moves beyond the upper trendline. This technical structure suggests that while the price has been under pressure, it has been consistently creating lower highs

Sushi Turns Bullish, Major Support Zone Left Behind · $105 Next?A major support zone from November 2020 has been left behind. The launch pad for Sushi's previous bull market. Let me explain.
Right after SUSHIUSDT became available for trading late August 2020 it started a strong decline. This decline found support at a low point November 2020. To this day, this

$SUSHI Flips Resistance into Support, Next Leg Loading?CRYPTOCAP:SUSHI Long Setup
Breakout from the Expanding channel on strong volume✅
Now flipping resistance into support, an ideal retest zone is forming.
Entry: 0.69 – 0.72
Stop Loss: 0.64
Targets:
TP1: 0.88
TP2: 1.11
Looks like momentum is building; watching for continuation after retest 🔥
DYOR |

See all ideas
Summarizing what the indicators are suggesting.
Oscillators
Neutral
SellBuy
Strong sellStrong buy
Strong sellSellNeutralBuyStrong buy
Oscillators
Neutral
SellBuy
Strong sellStrong buy
Strong sellSellNeutralBuyStrong buy
Summary
Neutral
SellBuy
Strong sellStrong buy
Strong sellSellNeutralBuyStrong buy
Summary
Neutral
SellBuy
Strong sellStrong buy
Strong sellSellNeutralBuyStrong buy
Summary
Neutral
SellBuy
Strong sellStrong buy
Strong sellSellNeutralBuyStrong buy
Moving Averages
Neutral
SellBuy
Strong sellStrong buy
Strong sellSellNeutralBuyStrong buy
Moving Averages
Neutral
SellBuy
Strong sellStrong buy
Strong sellSellNeutralBuyStrong buy
Displays a symbol's price movements over previous years to identify recurring trends.
Frequently Asked Questions
The current price of SUSHI / UST (SUSHI) is 0.73585000 USDT — it has risen 4.46% in the past 24 hours. Try placing this info into the context by checking out what coins are also gaining and losing at the moment and seeing SUSHI price chart.
SUSHI / UST price has fallen by −14.02% over the last week, its month performance shows a 23.36% increase, and as for the last year, SUSHI / UST has increased by 13.42%. See more dynamics on SUSHI price chart.
Keep track of coins' changes with our Crypto Coins Heatmap.
Keep track of coins' changes with our Crypto Coins Heatmap.
SUSHI / UST (SUSHI) reached its highest price on Mar 13, 2021 — it amounted to 23.36700000 USDT. Find more insights on the SUSHI price chart.
See the list of crypto gainers and choose what best fits your strategy.
See the list of crypto gainers and choose what best fits your strategy.
SUSHI / UST (SUSHI) reached the lowest price of 0.44989000 USDT on Aug 5, 2024. View more SUSHI / UST dynamics on the price chart.
See the list of crypto losers to find unexpected opportunities.
See the list of crypto losers to find unexpected opportunities.
The safest choice when buying SUSHI is to go to a well-known crypto exchange. Some of the popular names are Binance, Coinbase, Kraken. But you'll have to find a reliable broker and create an account first. You can trade SUSHI right from TradingView charts — just choose a broker and connect to your account.
Crypto markets are famous for their volatility, so one should study all the available stats before adding crypto assets to their portfolio. Very often it's technical analysis that comes in handy. We prepared technical ratings for SUSHI / UST (SUSHI): today its technical analysis shows the sell signal, and according to the 1 week rating SUSHI shows the sell signal. And you'd better dig deeper and study 1 month rating too — it's sell. Find inspiration in SUSHI / UST trading ideas and keep track of what's moving crypto markets with our crypto news feed.
SUSHI / UST (SUSHI) is just as reliable as any other crypto asset — this corner of the world market is highly volatile. Today, for instance, SUSHI / UST is estimated as 7.29% volatile. The only thing it means is that you must prepare and examine all available information before making a decision. And if you're not sure about SUSHI / UST, you can find more inspiration in our curated watchlists.
You can discuss SUSHI / UST (SUSHI) with other users in our public chats, Minds or in the comments to Ideas.