AAPL Technical Analysis for Oct. 28, 2024Key Levels:
Resistance Levels:
$232.00: Recent overhead resistance; a strong breakout above this level may signal bullish momentum.
$237.23: A significant resistance level where a potential reversal may occur.
Support Levels:
$230.05 - $227.75: This area shows a cluster of recent support. A breakdown below $227 could see further downside.
$224.00 (Approx): Lower support boundary if price weakens further.
Indicators:
Volume: Elevated volume suggests active trading, but observe if there's declining volume on a pullback, which could imply consolidation.
MACD (lower panel): Shows potential bearish momentum, though it’s near the zero line, indicating a weak trend that may go either way depending on volume.
Suggested Trading Plan:
Bullish Scenario: Look for a strong breakout above $232 with volume, targeting $237 for a quick scalp. Consider a stop-loss around $230 to manage risk.
Bearish Scenario: If the price breaks down below $227 with increasing selling volume, consider entering a short position, targeting $224, with a stop around $230.
Short Disclaimer:
"This analysis is for informational purposes only and not financial advice. Always conduct your own research before making trading decisions."
APC trade ideas

Mega Cap Earnings Preview - GOOGL MSFT META AAPL AMZNWe have a big week of earnings and economic data incoming. I'm seeing a lot of good setups, but I'll want to wait until after earnings to make any big moves. There should be some great opportunities this week with everything going on, no need to gamble on high IV contracts before. Here's some charts that are most important for me to watch this week.

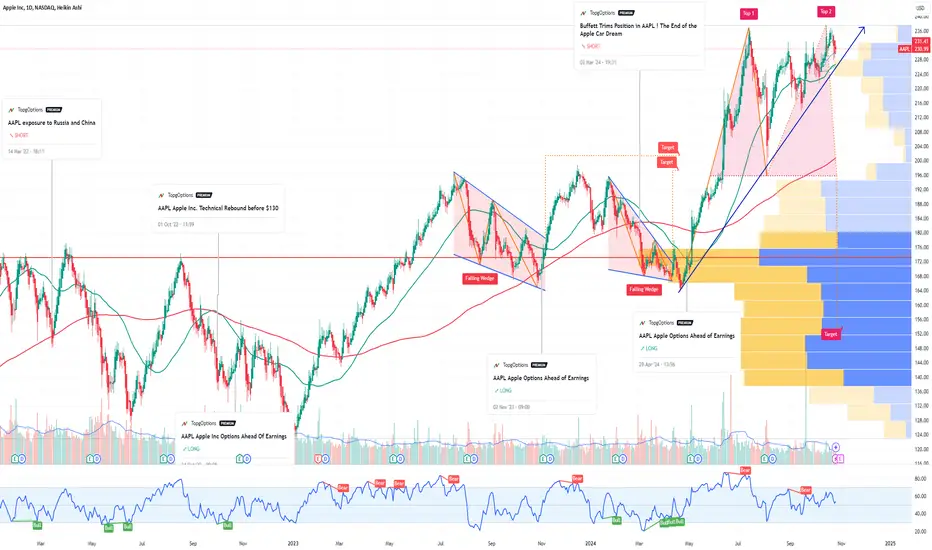
AAPL Apple Options Ahead of Earnings If you haven`t bought AAPL before this major breakout:
Now analyzing the options chain and the chart patterns of AAPL Apple prior to the earnings report this week,
I would consider purchasing the 232.5usd strike price Calls with
an expiration date of 2024-11-1,
for a premium of approximately $4.05.
If these options prove to be profitable prior to the earnings release, I would sell at least half of them.

Apple Calls Be careful!!!News: Apple will be reporting earnings on Thursday October 31.
Apple has a high of 237.49 that was created on Tuesday October 15, 2024. This high created has topped the previous high 237.23 created on Monday July 15, 24.
Pattern we are trading is is a ascending triangle tu the up side on the daily and 4hr time frame.
Every pull back has created a Higher Low (HL) which continues bullish momentum.
In the ascending triangle pattern, i have created two trendlines indicating support.
The dash line being the weak and the solid line being the strongest.

APPLE Under Pressure! SELL!
My dear friends,
APPLE looks like it will make a good move, and here are the details:
The market is trading on 234.99 pivot level.
Bias - Bearish
Technical Indicators: Supper Trend generates a clear short signal while Pivot Point HL is currently determining the overall Bearish trend of the market.
Goal - 229.05
Recommended Stop Loss - 238.19
About Used Indicators:
Pivot points are a great way to identify areas of support and resistance, but they work best when combined with other kinds of technical analysis
———————————
WISH YOU ALL LUCK

AAPL - LONGLots of bullish call buyers on spy, expecting this breakout to ride to the $246.84 area breakout fib. Earnings should help the push too.

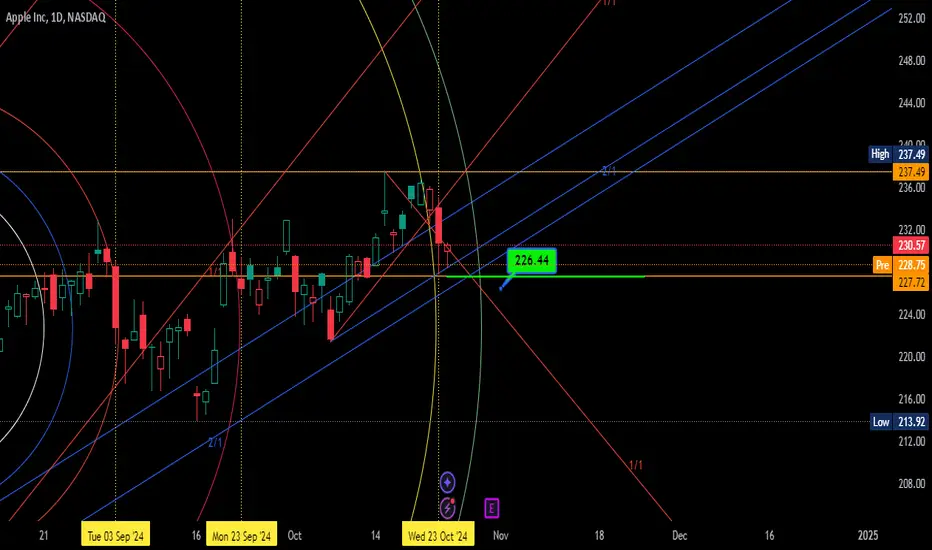
APPLENever ignore double top/bottom it is taken support to 2/1 line and just below have an important support it might take reversal this is make or break level,another perspective is clearly shown time of reversal which is drawn in yellow colour,this may minor or major,
The #1 Best Stock Of October 2024 Here Is Why...This stock NASDAQ:AAPL on Thursday next week
prepare yourself with risk management strategies, and profit
taking strategies to take advantage of this opportunity
-
This gap will happen on the 31 Of October, 2024.As I am looking
at this price action, I can not help to wonder
"What if am wrong?"
You see the problem with most financial markets Journalists
they don't have experience in technical analysis like myself
and so its very difficult for most editors
To pick a side of whether to buy or sale a stock
Even before this market crash that is from happening
in Apple stock.
I was very confident in its price rise
because apple has the biggest market cap on the NASDAQ
stock exchange market.
But there is another reason why
this stock is the spotlight, its because it follows the rocket booster
strategy, which has the following 3 steps:
#1-The price has to be above the 50 EMA
#2-The price has to be above the 200 EMA
#3-The price has to gap up in a trend
Listen the gap up is market psychology...
sometimes it happens and sometimes it doesn't
But if it does then that is you signal
To let you know that you are on the right path.
Rocket boost this content to learn more.
-
Disclaimer:Trading is risky you will lose money
whether you like it or not. Please learn risk
management and profit-taking strategies.

APPLE Long From Rising Support! Buy!
Hello,Traders!
APPLE is trading in an
Uptrend along the rising
Support line and the stocks
Is now retesting it so we are
Locally bullish biased and
We will be expecting a
Further move up
Buy!
Like, comment and subscribe to help us grow!
Check out other forecasts below too!

APPLE - IndoChina has 1.387 Billion people IndoChina is where everyone has gone to manufacture. There is a huge army of workers employees by American manufacturers from Lexington Furniture (the largest in the USA that has outsourced everything to that area) sneakers, garments, and much more, and delivering excellent quality as a patter of fact.
Well all these workers have bought Iphones for themselves and their families. I expect a sizable beat. Now the technically to me look good.
Best of luck.
M

AAPL Triangle RetestSimilar to TSLA, AAPL had a nice triangle breakout and is retesting it now. Very important level IMO, we have two trendlines that should act as support along with the 225-230 area of horizontal support.
If it holds here on the retest, will most likely lead to a move back up to ATH, could long on the green arrow. If not, I'd look for these trendlines to break and retest, could short on the red arrows.

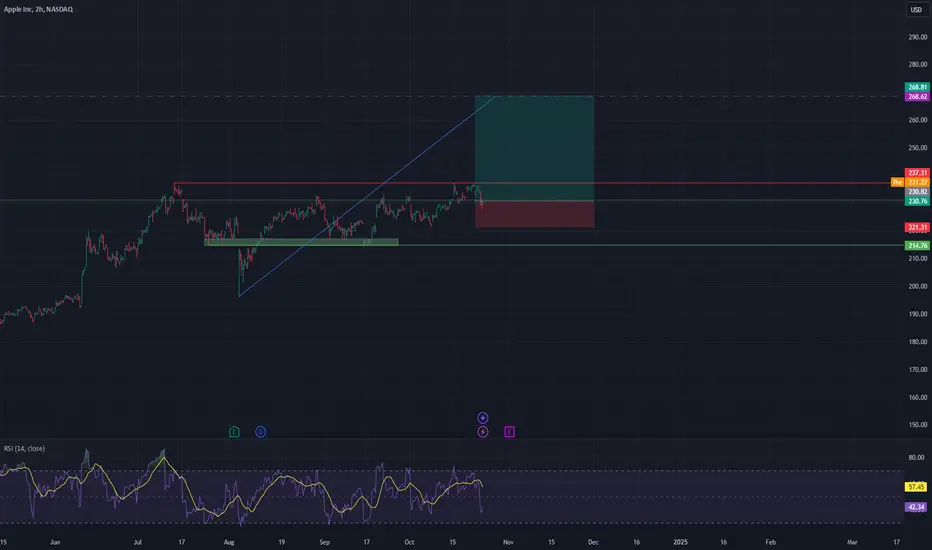
AAPL LONG TRADING PLAN (APPLE)🚨 Stock Trading Signal Alert
📝 Stock Name (Ticker): Apple (AAPL)
📊 Signal Type: Buy
💼 Entry Price: $220.76
🎯 Take Profit: 268.62
🛡️ Stop Loss: $221.30
⌛ Timeframe: 4H, 1D
📅 Date: Oct 24, 2024
📈 Analysis: Making HH HL, and its make a Bullish Flag. According to my projections it can go at 268.63. But you can do profit taking.
APPL TESLA apple be moving like Tesla now so going to wait for you to hit the support trend line then by for a move upward
But might sell now if you willing to risk


AAPL Apple Inc. Ascending Triangle NASDAQ:AAPL AAPL Apple Inc. Ascending Triangle Look, it looks like it might break to the upside depending on market conditions. Looking at next week's 237.5 calls. Not financial advice could easily see a pull back, AAPL like NVDA loves to close very close to strike prices making options worthless.

AAPL Update: Value Surge ExpectedAfter my previous post, my call options appreciated by a generous ~70% avg. Profit was taken, and new positions are being opened now.
The past couple weeks we have seen price crowding around the $236 level. This was a previous high from many months ago. I believe investors value Apple much higher than they did at that point. From our series of lower lows, visible on practically every time frame, I am seeing the bears surrender.
We have seen a tight consolidation, rising volume, and bullish momentum recently. I am expecting to see a new ATH any day now, followed by a bull cycle. Look for a value increase in the coming weeks/months.

$AAPL 10 Days Till EarningsWe are now 10 days till earnings and AAPL has formed a strong supply zone at its all time high area.
It is possible that we may see a significant move before their earnings report. The question is where.
This setup looks like an ascending triangle, it is possible we see a break above the all time high for a move previous to earnings.
In the case we break wedge support there are levels to watch as well below.

The TradingView Show: Charting Big Moves with TradeStationJoin us for our recurring series as we breakdown in great detail the latest market movements, emerging trends, and critical financial news with @TradeStation. This monthly show is meticulously crafted to keep traders informed about the developments that truly impact the markets. Explore our comprehensive video library on our profile—just scroll back to catch up on past episodes. And remember to follow our @TradingView account to ensure you never miss a show.
For our new traders, this episode will provide actionable insights, educational resources on charting, and a robust introduction to market dynamics.
In this episode, we’ll cover the following topics:
- Top-down analysis for informed decision-making
- Essential crude oil charts and their implications for energy stocks
- Insights into small-cap trends
- A deep dive into semiconductor stocks like ASML and NVDA
- The recent breakout in the banking sector
- An analysis of ratio charts for strategic positioning
- And much more!
Our show goes live each month, welcoming traders and investors of all levels to join the discussion, ask questions, and gain insights into what’s moving the markets. We encourage you to engage—leave comments, share your thoughts, and spread the word with your friends.
This show is sponsored by TradeStation. TradeStation pursues a singular vision to offer the ultimate online trading platform and services for self-directed traders and investors across the equities, equity index options, futures, and futures options markets. Equities, equities options, and commodity futures products and services are offered by TradeStation Securities Inc., member NYSE, FINRA, CME, and SIPC.
See below:
www.tradestation.com
www.tradestation.com
Thank you for tuning in!

AAPL - 1D - Ascending TriangleApple is trading just 1% below its all-time highs, positioned at the apex of an ascending triangle.
The Supertrend is green and bullish, with the MACD showing a strong upward momentum, signaling a potentially volatile breakout on the horizon.
At the same time, NVDA is closing in on the title of 'world's largest company, ending Friday with a market cap of $3.39T, compared to AAPL's $3.57T.
The question is: Will Apple be dethroned?

Medium-Term Buy Trade on Apple Stock (AAPL): Are We at the StartHello, dear followers! I'm presenting a comprehensive analysis for a buy trade on Apple (AAPL), currently trading at $227. According to my technical analysis, the stock is approaching a key resistance level at $230. If it successfully breaks this level, the next target will be $250.
Trade Details:
Type of Trade: Buy
Entry Point: $227
Stop Loss: $220
Profit Target: $250
Why Follow Me?
I will be sharing regular updates on this trade along with technical and fundamental analyses, helping you make informed decisions. If you enjoy the analysis, feel free to follow me for more successful trades and strategic insights. I also welcome comments and discussions about market forecasts.
Remember that trading carries risks, so please do your own research before making any investment decisions. Let's embark on this trading journey together!

The #1 Reason Apple Stock Should Be On Your WatchlistForming the top 13 iron watchlist, was one of the
most important things I did as a trader in the
financial markets.
-
When I began to look for a strategy
I wanted a strategy that would reduce my trading stress
and make my life easy.It was because of this that's
why I formed the "Top 13 Iron Watchlist"
This is why on the 2nd Of November am
going to reveal the Price Update of the Top 13 Iron Watchlist
Meanwhile let me share with you
the rocket booster strategy:
#1-The price has to be above the 50 EMA
#2-The price has to be above the 200 EMA
#3-The price has to gap up in a trend
If you look at this stock NASDAQ:AAPL
You will see this strategy in effect on it.
The benefits of this strategy is that
you can see the uptrend of the price you
are trading.
Remember to rocket boost this content to learn more.
Disclaimer:Trading is risky, you will lose money
wether you like it or not
please learn risk management
and profit taking strategies.

APPLE: Bearish Continuation & Short Trade
APPLE
- Classic bearish setup
- Our team expects bearish continuation
SUGGESTED TRADE:
Swing Trade
Short APPLE
Entry Point - 234.99
Stop Loss - 238.93
Take Profit - 227.89
Our Risk - 1%
Start protection of your profits from lower levels
❤️ Please, support our work with like & comment! ❤️
