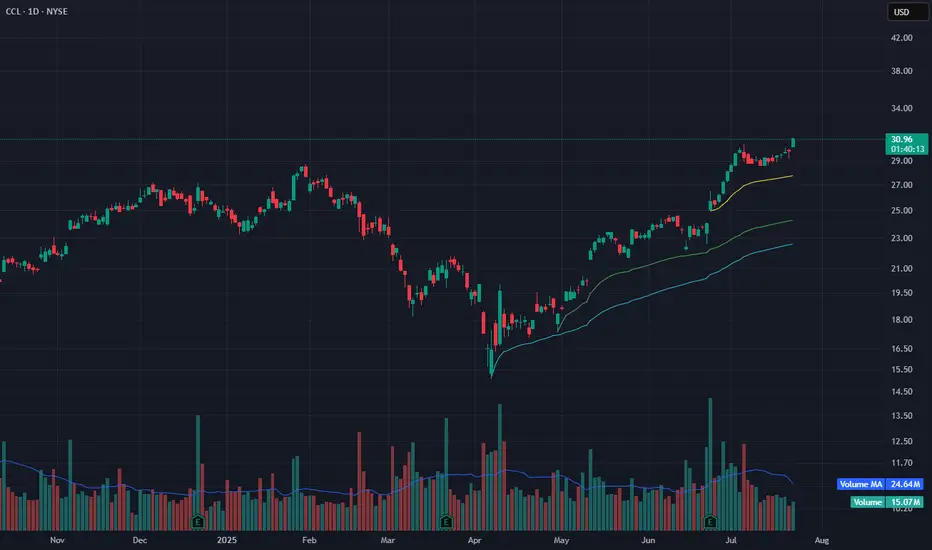
CCL Breakout With Strong Volume – Riding Above All Anchored VWAPCCL just broke out to new local highs with strong follow-through and volume rising above 15M. Price is well above all anchored VWAP levels, including the recent breakout VWAP (yellow line) and deeper trend VWAPs (green and blue), showing strong bullish momentum.
This kind of clean separation often
Next report date
—
Report period
—
EPS estimate
—
Revenue estimate
—
1.740 EUR
1.81 B EUR
23.66 B EUR
1.08 B
About Carnival Corporation
Sector
Industry
CEO
Josh Weinstein
Website
Headquarters
Miami
Founded
1972
ISIN
PA1436583006
FIGI
BBG000DBGJ47
Carnival Corp. engages in the operation of cruise ships. It operates through the following business segments: North America and Australia (NAA) Cruise, Europe and Asia (EA) Cruise Operations, Cruise Support, and Tour and Others. The North America and Australia (NAA) Cruise segment includes the Carnival Cruise Line, Holland America Line, Princess Cruises, and Seabourn. The Europe and Asia (EA) Cruise Operations segment consists of AIDA, Costa, Cunard, and P&O Cruises (UK). The Cruise Support segment represents port destinations and private islands for the benefit of its cruise brands. The Tour and Other segment operates hotel and transportation operations of Holland America Princess Alaska Tours. The company was founded in 1972 and is headquartered in Miami, FL.
Related stocks
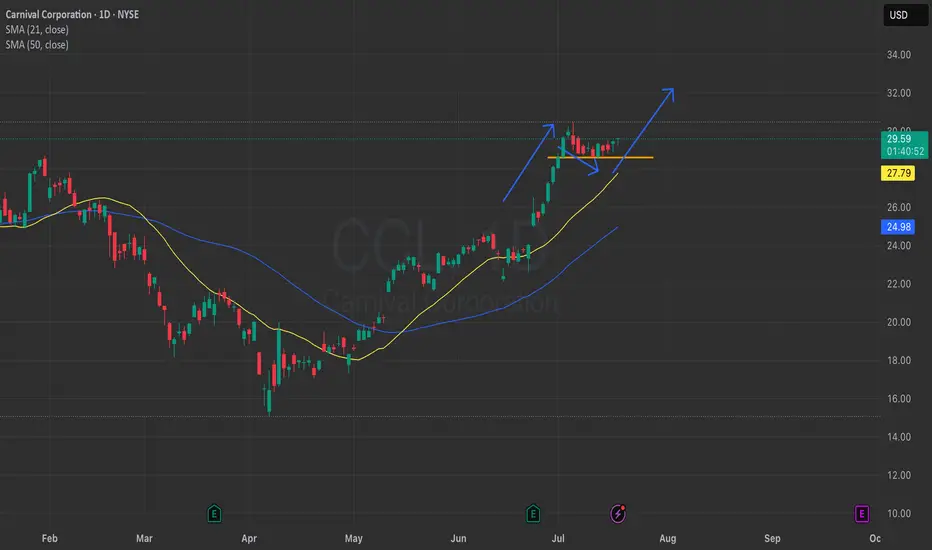
Cruising Towards Growth: Why Carnival Corporation Could Be a SmaCurrent Price: $29.55
Direction: LONG
Targets:
- T1 = $30.60
- T2 = $32.50
Stop Levels:
- S1 = $28.75
- S2 = $27.90
**Wisdom of Professional Traders:**
This analysis synthesizes insights from thousands of professional traders and market experts, leveraging collective intelligence to identify

CCL Bull Flag BreakoutNYSE:CCL looks like it is starting to break out of a Bull Flag. Everyone has been focusing on NYSE:RCL , yet CCL has alot more upside potential.
Stronger Upside Potential for CCL: Long Trade Opportunity Next W
Current Price: $20.19
Direction: LONG
Targets:
- T1 = $21.50
- T2 = $22.50
Stop Levels:
- S1 = $19.50
- S2 = $18.50
**Wisdom of Professional Traders:**
This analysis synthesizes insights from thousands of professional traders and market experts, leveraging collective intelligence to identif

Carnival Corporation: Value Play in the Cruise Sector’s RecoveryThe cruise industry has weathered a stormy economic climate, but Carnival Corporation (NYSE: CCL) emerges as a standout opportunity for investors. With its stock sliding from $26 to $17 per share—and its ADR (CUK) at $15.59 as of April 22— Carnival’s valuation reflects market pressures rather than i

Carnival Corporation (2 hours chart, NYSE) - Long PositionCCL - Carnival Corporation (2 hours chart, NYSE) - Long Position; Short-term research idea.
Risk assessment: High {volume & support structure integrity risk}
Risk/Reward ratio ~ 2.33
Current Market Price (CMP) ~ 18.53
Entry limit ~ 18.30 to 18.10 (Avg. -18.20) on April 24, 2025
1. Target lim

$CCL - Another one about to retest the trendlineNYSE:CCL Another chart that is about to retest trendline started back in Oct 2022. 👀 The market is already pricing in a recession way ahead of time.

Carnival Corporation (CCL) Report Financial Results for Q1 2025Carnival Corporation & plc (NYSE/LSE: CCL; NYSE: CUK) announced financial results for the first quarter 2025 and provided an updated outlook for the full year and an outlook for the second quarter 2025.
Record first quarter revenues of $5.8 billion, up over $400 million compared to the prior year.

Carnival Corp., Wave 5, the first TP is the previous high, whichWave 5, the first TP is the previous high, which is also fibo 127% NYSE:CCL

CCL in Buy ZoneMy trading plan is very simple.
I buy or sell when at three of these events happen:
* Price tags the top or bottom of parallel channel zones
* Money flow spikes beyond it's Bollinger Bands
* Stochastic Momentum Index (SMI) at near oversold overbought level
* Price at Fibonacci levels
So...
Here's

See all ideas
An aggregate view of professional's ratings.
Neutral
SellBuy
Strong sellStrong buy
Strong sellSellNeutralBuyStrong buy
Neutral
SellBuy
Strong sellStrong buy
Strong sellSellNeutralBuyStrong buy
Neutral
SellBuy
Strong sellStrong buy
Strong sellSellNeutralBuyStrong buy
Displays a symbol's price movements over previous years to identify recurring trends.
CCL5992329
Carnival Corporation 6.125% 15-FEB-2033Yield to maturity
5.69%
Maturity date
Feb 15, 2033
CCL6118464
Carnival Corporation 5.75% 01-AUG-2032Yield to maturity
5.56%
Maturity date
Aug 1, 2032
CCL6075368
Carnival Corporation 5.875% 15-JUN-2031Yield to maturity
5.49%
Maturity date
Jun 15, 2031
USP2121VAL8
CARNIVAL CRP 21/27 REGSYield to maturity
5.47%
Maturity date
Mar 1, 2027
CCL5284215
Carnival Corporation 6.0% 01-MAY-2029Yield to maturity
5.46%
Maturity date
May 1, 2029
CCL6009652
Carnival Corporation 5.75% 15-MAR-2030Yield to maturity
5.43%
Maturity date
Mar 15, 2030
CCL5627300
Carnival Corporation 7.0% 15-AUG-2029Yield to maturity
5.39%
Maturity date
Aug 15, 2029
US143658BN1
CARNIVAL CRP 21/27 144AYield to maturity
5.38%
Maturity date
Mar 1, 2027
USP2121VAM6
CARNIVAL CRP 21/28 REGSYield to maturity
5.25%
Maturity date
Aug 1, 2028
CCL.GE
Carnival Corporation 6.65% 15-JAN-2028Yield to maturity
4.53%
Maturity date
Jan 15, 2028
XS280922242
CARNIVAL 24/30 REGSYield to maturity
3.64%
Maturity date
Jan 15, 2030
See all CVC1 bonds
Curated watchlists where CVC1 is featured.

Frequently Asked Questions
Depending on the exchange, the stock ticker may vary. For instance, on SWB exchange Carnival Corp. stocks are traded under the ticker CVC1.
We've gathered analysts' opinions on Carnival Corp. future price: according to them, CVC1 price has a max estimate of 32.29 EUR and a min estimate of 17.36 EUR. Watch CVC1 chart and read a more detailed Carnival Corp. stock forecast: see what analysts think of Carnival Corp. and suggest that you do with its stocks.
CVC1 reached its all-time high on Jun 22, 2017 with the price of 60.100 EUR, and its all-time low was 6.330 EUR and was reached on Oct 11, 2022. View more price dynamics on CVC1 chart.
See other stocks reaching their highest and lowest prices.
See other stocks reaching their highest and lowest prices.
Yes, you can track Carnival Corp. financials in yearly and quarterly reports right on TradingView.
Carnival Corp. is going to release the next earnings report on Sep 26, 2025. Keep track of upcoming events with our Earnings Calendar.
CVC1 earnings for the last quarter are 0.31 EUR per share, whereas the estimation was 0.22 EUR resulting in a 42.77% surprise. The estimated earnings for the next quarter are 1.12 EUR per share. See more details about Carnival Corp. earnings.
Carnival Corp. revenue for the last quarter amounts to 5.58 B EUR, despite the estimated figure of 5.47 B EUR. In the next quarter, revenue is expected to reach 6.87 B EUR.
CVC1 net income for the last quarter is 498.02 M EUR, while the quarter before that showed −75.19 M EUR of net income which accounts for 762.33% change. Track more Carnival Corp. financial stats to get the full picture.
EBITDA measures a company's operating performance, its growth signifies an improvement in the efficiency of a company. Carnival Corp. EBITDA is 6.06 B EUR, and current EBITDA margin is 24.50%. See more stats in Carnival Corp. financial statements.
Like other stocks, CVC1 shares are traded on stock exchanges, e.g. Nasdaq, Nyse, Euronext, and the easiest way to buy them is through an online stock broker. To do this, you need to open an account and follow a broker's procedures, then start trading. You can trade Carnival Corp. stock right from TradingView charts — choose your broker and connect to your account.