Tesla Sell Signals- 05/30/25Tesla Inc. has several bearish signals.
On 05/29/25 it peaked close to 02/19/25 top.
RSI on 05/29/25 had a bearish divergence vs. its 05/14/25 reading. Also, the reading on 05/30/25 was below the reading made at 05/21/25, predicting price could go down to the where it was on 05/21/25.
Stochastic has a bearish line cross in the overbought zone above 80.00.
On 05/30/25 the price went below the low of the big up bar made on 05/27/25.
First support is in the 285 to 270 area.
Price could ultimately go much lower.
TL0 trade ideas

Tesla: Completed!TSLA has moved somewhat closer to the resistance at $373.04 since our last update, but these gains have now been tempered. We now consider the turquoise wave 4 as finished and anticipate imminent sell-offs during wave 5. These should eventually complete the magenta wave (3) of a larger downward impulse below the support at $215.01. However, due to recent upward momentum, we have increased the relevance of our alternative scenario. We now consider it 38% likely that the stock has already completed the large correction of the blue wave alt.(II) with the last significant low and will continue to rise directly during wave alt.(III). In this case, the price would next not only rise above the nearby resistance at $373.04 but also overcome the higher levels at $405.54 and $488.50.
📈 Over 190 precise analyses, clear entry points, and defined Target Zones - that's what we do.

Is This the Perfect Moment to Execute the Tesla Heist?💰 Tesla Stock Market Heist Blueprint 🚀
🌟 Hi! Hola! Ola! Bonjour! Hallo! Marhaba! 🌟
Dear Money Makers & Robbers, 🤑💰💸✈️
Here’s our grand plan: a 🔥Thief Trading Style heist🔥 targeting the TESLA stock! Let’s break in with this cunning strategy — chart-ready and primed for action!
🎯 Entry:
The vault’s open! Grab the bullish loot at any price — the heist is live!
Tip: For precision, use a buy limit order on 15m/30m swing highs or lows — that’s your perfect pullback entry!
🛑 Stop Loss:
Thief SL is stashed at the nearest swing low (or just below the MA on the daily chart ~300.00 for swing trades).
Tailor SL to your trade risk, lot size, and your thieving gang’s order plan.
🏴☠️ Target:
460.00 — or vanish before hitting the target to avoid the traps of the overbought zone!
💎 The Setup:
We’re seeing bullishness fueled by key factors: macro moves, fundamentals, sentiment, intermarket trends… it’s all in play! 📈🔗🌏
Check the macro, COT report, sentiment outlook, and future trend targets to stay ahead of the game!
⚠️ Trading Alert:
News releases can flip the game fast.
Avoid fresh trades during major news.
Use trailing stops to lock in those juicy profits and protect your loot.
❤️🔥 Support the Heist Crew!
💥Hit the Boost Button💥 — fuel our robbery plans and let’s keep cashing in every day!
The Thief Trading Style: slick, powerful, and ready for the next heist.
See you soon with another plan, fellow robbers! 🤑🐱👤🤩

Musk Steps Away from Politics: What Does It Mean for Tesla?Musk Steps Away from Politics: What Does It Mean for Tesla (TSLA) Stock?
Yesterday, it was announced that Elon Musk will be stepping down from the Trump administration as his term as head of DOGE—where he focused on reducing government spending—has come to an end.
This decision follows his statement at the economic forum in Qatar, where Musk said he plans to focus less on politics, as he feels he has already done enough in that realm.
What Does This Mean for Tesla (TSLA) Stock?
Musk’s move away from politics is likely a positive signal for investors. Here's why:
→ The company’s CEO can now devote more time to addressing issues such as declining vehicle sales in Europe;
→ Musk’s role at DOGE will no longer pose reputational risks for Tesla..
During yesterday’s main trading session, TSLA stock surged to $367—its highest level since mid-February.
Technical Analysis of TSLA Stock Chart
The price continues to hover near the upper boundary of an ascending channel (marked in blue), which could pose a challenge for further upward movement.
Additionally, the price has entered the $355–$375 range—a zone that previously triggered significant reversals (as indicated by arrows). Notably, there was a sharp decline from this zone between February 21–26. From a bearish standpoint, this area could act as resistance, and the candle’s close near its low yesterday supports this view.
From a bullish perspective, the fundamental outlook may still provide upward momentum:
→ A joint press conference with Trump and Musk is scheduled for today;
→ In early June, Tesla is expected to begin testing its autonomous taxis.
So, while a continued uptrend is possible, a short-term correction would seem reasonable after TSLA’s nearly 27% surge throughout May.
This article represents the opinion of the Companies operating under the FXOpen brand only. It is not to be construed as an offer, solicitation, or recommendation with respect to products and services provided by the Companies operating under the FXOpen brand, nor is it to be considered financial advice.

Tesla - continuationEven with bad earnings, the Tesla stock got pushed up, this has something with Sentiment and Momentum to do but would take to long to explain, what is important from price action it did everything right and all indicators for a successfull trendchange are verified.

easy play on TESLAThose who know me know that this one on Tesla is an easy play, it's a chill idea, because I'm a chill person, so I assure you this is one of the chillest ideas ever, a bounce is mandatory here.

#TESLA - 30 Points MoveDate: 19-05-2025
#TESLA
Current Price: 340.15
Mid-Point: 340.42
Upside Targets: 355.54, 363.22, 371.77 and 380.32
Downside Targets: 325.33, 317.62, 309.07 and 300.52
Support: 333.05
Resistance: 347.85

Tesla Stock Analysis: Anticipating a Dip Before a Surge to $366Currently, Tesla's stock is trading around $298, and I'm expecting a slight retrace downwards towards the $250 to $268 price range. From that area, I anticipate a rally upwards, targeting the $366 area.
In summary:
Current Price: Around $298.
Expected Retrace: To the $250 - $268 range.
Expected Rally: Towards $366.
Please remember that this is just an analysis and a forecast, and the stock market is unpredictable. Always conduct your own thorough research before making any investment decisions.

Tesla Ascending Parallel Channel for Trend ContinuationTesla Ascending Parallel Channel for Trend Continuation
Stop Loss: 333.21
Buy Stop: 389.34
TP1: 443.32
TP2: 495.54
No Divergence

TSLA New ATH incoming? Overview of primary catalysts.After trading between $346 and $365 intraday on May 27, Tesla shares closed at $362.89—up modestly despite broader market headwinds and lingering investor skepticism.
Here’s a detailed breakdown of the primary catalysts shaping Tesla’s stock price (ranked 0–10):
1. Electric Vehicle Demand Growth
Strength: 9/10
Global EV adoption remains the single largest driver of Tesla’s top line. Despite slowing sales in Europe and China, overall EV penetration continues to surge as consumers shift away from internal-combustion engines.
2. Launch of Affordable Model (Entry-Level EV)
Strength: 8.5/10
Elon Musk has reiterated plans to unveil a sub-$25,000 EV in early 2025, targeting the mass market. Investors cheered a recent reaffirmation of focus on core products over peripheral projects.
3. Battery Cost Reductions & Margin Expansion
Strength: 8/10
Tesla’s relentless drive to lower battery pack costs underpins both profitability and price competitiveness. Q4 cost of goods sold dipped below $35,000 per vehicle, even as margins softened amid mixed volumes.
4. Autonomy & Robotaxi Progress
Strength: 7.5/10
Commercial robotaxi trials are slated to begin in Austin in June 2025, with a dedicated Cybercab in development. While regulatory and safety hurdles loom, the promise of recurring software subscription revenue could be transformative.
5. Competition from Other EV Manufacturers
Strength: 7/10
Legacy automakers and startups alike are ramping up EV offerings. Tesla’s U.S. market share has declined in recent years, highlighting intensifying pressure in key regions.
6. U.S.–China Trade Policies & Tariffs
Strength: 6.5/10
Fluctuating tariffs on Chinese EV imports have led to order suspensions and forecasting challenges. Trade-policy uncertainty remains a wild card given Tesla’s global supply chain.
7. Regulatory Incentives & Subsidies
Strength: 6/10
U.S. federal tax credits under the Inflation Reduction Act and similar programs in Europe and China support EV demand—and Tesla’s eligibility criteria will influence its market growth.
8. Commodity Price Volatility (Lithium, Nickel, Cobalt)
Strength: 5.5/10
Raw material cost swings can erode margins. While long-term supply agreements help, spot shortages or price spikes remain risks.
9. Fed “Higher for Longer” Interest Rate Environment
Strength: 5/10
Elevated real yields reduce the appeal of high-growth names like Tesla. A sustained hawkish stance from the Fed could continue to cap valuations, similar to how it weighs on non-yielding assets.
10. Corporate Governance & Elon Musk’s Public Profile
Strength: 4/10
Musk’s high-profile engagements and occasional controversies can politicize the brand, prompting sentiment-driven stock swings.
Catalyst Strength Rankings (May 2025)
🔸 EV demand growth: 9
🔸 Affordable Model launch: 8.5
🔸 Battery cost & margins: 8
🔸 Autonomy/robotaxi progress: 7.5
🔸 Competition: 7
🔸 Trade & tariffs: 6.5
🔸 Regulatory incentives: 6
🔸 Commodity costs: 5.5
🔸 Fed rates: 5
🔸 Musk profile: 4
Analyst Forecasts for 2025
| Analyst / Consensus | 12-Month Price Target | Rating |
| --------------------------- | --------------------- | ------------ |
| High | \$470.00 | – |
| Median | \$306.00 | Hold/Neutral |
| Low | \$115.00 | – |
| Average (Consensus) | \$306.29 | Hold |
| Dan Ives (Wedbush) | \$315 | Outperform |
| Adam Jonas (Morgan Stanley) | \$430 | Overweight |
* Consensus sees a range of \$115–\$470 with an average near \$306.
* Dan Ives trimmed his target from \$550 to \$315, citing tariff risks and political headwinds.
* Adam Jonas remains bullish with a \$430 target, viewing Tesla as an “embodied AI compounder” despite near-term brand challenges.
Where to Next for Tesla?
* Current price: \~\$362.89
* Key support levels: \$350 and \$340
* Next technical floor: \$330
* Upside triggers: Stronger-than-expected delivery volumes, breakthrough in full-self-driving (FSD) reliability, or renewed cost cuts.
Tesla’s stock remains a balance between long-term disruptive potential and short-term execution risks. While EV adoption and autonomous ambitions underpin a compelling growth narrative, margin compression, competitive pressures, and macro uncertainties will dictate volatility in the months ahead.

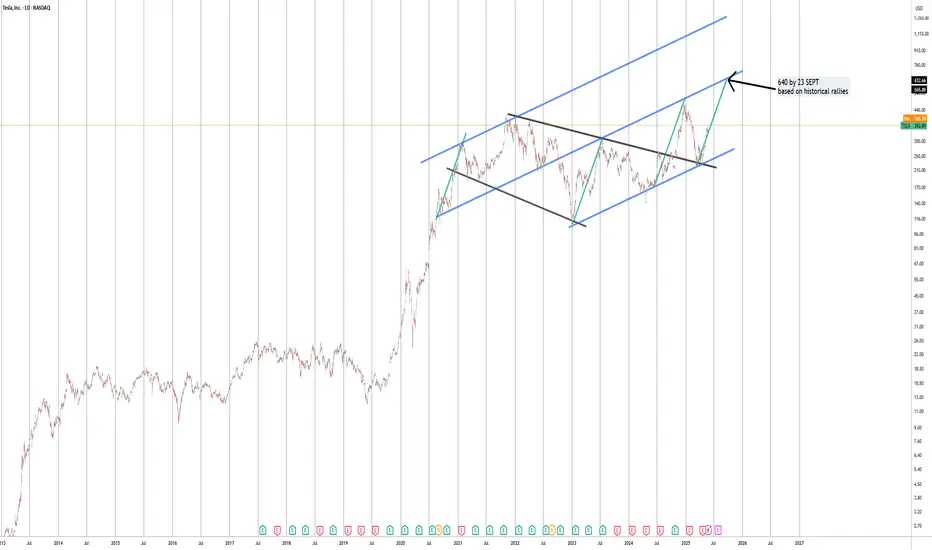
Tesla price target based on geometryTesla $640 by sept based purely on price geometry and trend analysis. In the past Tesla has shown rallies matching in time and price
$TSLA: Big bull flag? 400 soon? But tariff talks againMarket mix up. NASDAQ:TSLA Eyeing this, positioned for a couple weeks out on my calls which are ugly red but, I think this is setting up for something in the next few weeks? Although, feels like tariff talks again are not letting this run as well. #NFA

TSLA eyes on $350: not just a round number bot also Genesis fib TSLA has been butting up against $350 for a reason.
The round number is further reinforced by fibs.
Look for Break-n-Retest or Dip-to-Fib for entry.
$349.99 happens to be a Genesis fib (minor ratio)
$340.59 is a Golden Covid fib, another strong one.
$331.57 is a semi-major Genesis fib for support.
=======================
Previous Trade Calls below
=======================
$205 bottom call
Trump Pump dip buys
$294 Dunk then Break
=============================================
.

Tesla Inc. (TSLA) Technical Analysis and ForecastTSLA has demonstrated strong upward momentum since the market opened today, reaching a resistance level around the $362 zone.
From a technical perspective, there is potential for a short-term pullback to the $354 area, which aligns with the top of the support zone, also known as the "right shoulder" of the prevailing pattern.
Should this support level hold, we may anticipate a continued upward move, targeting higher price levels.
Key Levels to Watch:
Support Levels:
Primary Support: $354 zone
Secondary Support: $321 zone (as a deeper stop loss level)
Resistance/Take Profit Levels:
Target 1 (Take Profit): $440
Target 2 (Take Profit): $480 (previous all-time high)
Traders should approach this setup with caution, as always, adhering to sound risk management principles.

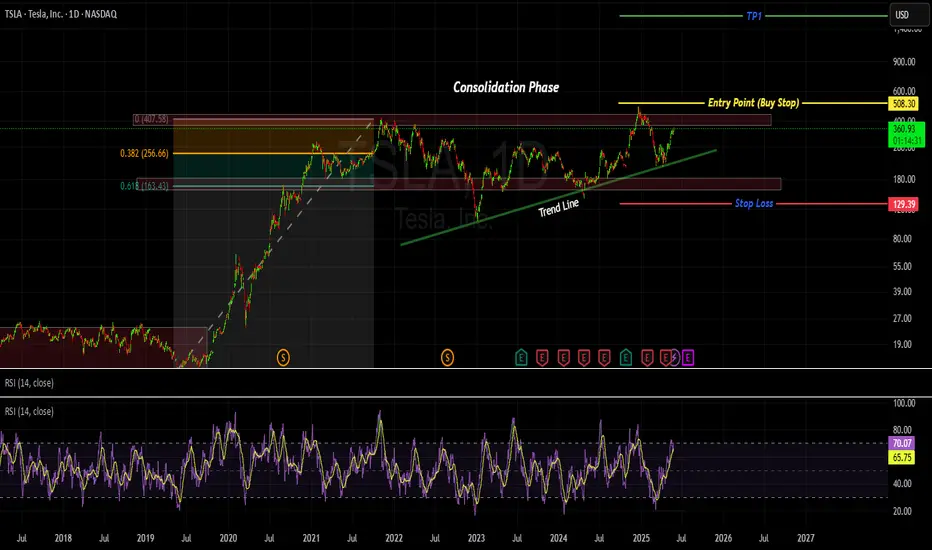
TESLA - POSTIONS ACCMULATING OR MARKET CONFUSION !!!!Hi, Tesla is making series of HH and HL. Bullish trend line can also be seen. however, it is in consolidation phase since long. currently the market is trading near the strong resistance level of 409. if the market break this support level and even breaks the previous HH which is 482 then we can expect market to take a bull ride.
Trade entry plan is to set BUY STOP order type at the mentioned Entry Point. once the trade is executed we can Set Stop Loss slightly below the previous HL /support level.
TP1 and TP2 are placed with 1:1 and 1:2 Reward to Risk ration
TSLA: Break-out above bull flag, possible cup and handle?So, a few days ago, I posted about a bull flag forming on the daily chart for Tesla. This flag pattern was a period of consolidation following an incredibly whooping rally from the $270 mark to around $350 (around a 30% or so gain).
Today, we have a new break-out from this consolidation period, and as of writing right now, Tesla is up 7%. It has now breached the $350 resistance level.
If you look more closely, the chart pattern resembles something close to a cup and handle pattern. You have the cup base going from the 20th of Feb 2025 all the way to the 14th of May 2025. Our bull flag which lasted between the 14th of May until the 23rd of May (last Friday), could as well be a handle for the cup base.
A break-out from not only the bull flag but the cup and handle could signal a massive move towards $400, however $375 and $390 could be points of resistance, and it would be wise to watch for a cooldown in the short-term.
Upcoming this week, it might worth mentioning that NASDAQ:NVDA earnings could have a strong impact on tech and affect Tesla - even if Tesla isn't much exposed to AI as the semiconductors.
To conclude, target is $390-$400 however as we all know, nothing is guaranteed :)
Note: Not financial advice. My analysis is not advice, rather just an idea. Please do your DD as well.

TESLA Index Stock Chart Fibonacci Analysis 052625Trading Idea
1) Find a FIBO slingshot
2) Check FIBO 61.80% level
3) Entry Point > 330/61.80%
Chart time frame:D
A) 15 min(1W-3M)
B) 1 hr(3M-6M)
C) 4 hr(6M-1year)
D) 1 day(1-3years)
Stock progress: B
A) Keep rising over 61.80% resistance
B) 61.80% resistance
C) 61.80% support
D) Hit the bottom
E) Hit the top
Stocks rise as they rise from support and fall from resistance. Our goal is to find a low support point and enter. It can be referred to as buying at the pullback point. The pullback point can be found with a Fibonacci extension of 61.80%. This is a step to find entry level. 1) Find a triangle (Fibonacci Speed Fan Line) that connects the high (resistance) and low (support) points of the stock in progress, where it is continuously expressed as a Slingshot, 2) and create a Fibonacci extension level for the first rising wave from the start point of slingshot pattern.
When the current price goes over 61.80% level , that can be a good entry point, especially if the SMA 100 and 200 curves are gathered together at 61.80%, it is a very good entry point.
As a great help, tradingview provides these Fibonacci speed fan lines and extension levels with ease. So if you use the Fibonacci fan line, the extension level, and the SMA 100/200 curve well, you can find an entry point for the stock market. At least you have to enter at this low point to avoid trading failure, and if you are skilled at entering this low point, with fibonacci6180 technique, your reading skill to chart will be greatly improved.
If you want to do day trading, please set the time frame to 5 minutes or 15 minutes, and you will see many of the low point of rising stocks.
If want to prefer long term range trading, you can set the time frame to 1 hr or 1 day.

TSLA bull flagTsla is ramping up here with a daily flag as we sit in the middle of the range between supply and demand zones on the weekly. There is plenty of room for BBWP and stochastic RSI to expand on the weekly chart.
Near term target 400$
My plan:
Buy some TSLL and sell CSP

TSLA cup and handle potentialTSLA looks like it's setting up for a bullish move with a potential cup and handle breakout on top of a potential bull flag formation on the daily. First PT at 350 psych level and 360-365, so long as it holds above 350.

Bullish Breakout Could Lead to Further Gains
Targets:
- T1 = $350.75
- T2 = $363.25
Stop Levels:
- S1 = $331.50
- S2 = $320.00
**Wisdom of Professional Traders:**
This analysis synthesizes insights from thousands of professional traders and market experts, leveraging collective intelligence to identify high-probability trade setups. The wisdom of crowds principle suggests that aggregated market perspectives from experienced professionals often outperform individual forecasts, reducing cognitive biases and highlighting consensus opportunities in Tesla.
**Key Insights:**
Tesla continues to demonstrate impressive resilience and positive technical setups despite broader market volatility. The stock has maintained its position above critical support levels, with buying activity persistently pushing prices upward. Key market drivers include Tesla’s leadership in electric vehicle innovation and artificial intelligence integration enhancing its long-term value proposition. Furthermore, renewed market enthusiasm for growth stocks contributes to Tesla’s current trajectory.
**Recent Performance:**
Recently, Tesla's price has stayed on a steady uptrend, advancing 2.7% over the past 7 days and outperforming both the NASDAQ and S&P 500 indices. While brief market corrections momentarily tested its support levels, Tesla quickly recovered, underscoring investor confidence in its growth trajectory. This strong relative outperformance confirms robust market interest in the stock as a leader in innovation.
Expert Analysis:
Market analysts have generally taken a curated bullish view on Tesla, citing multiple bullish technical indicators such as the ongoing price breakout above moving averages and a bullish consolidation pattern. Several analysts project $400 as the next key psychological level if Tesla can surpass its immediate resistance at $354.25. The fundamentals remain compelling, supported by Elon Musk's proactive engagement in Tesla's strategic advancements, which continues to instill confidence among shareholders.
News Impact:
Tesla’s current spotlight is bolstered by anticipation around its robo-taxi service, renewed AI ambitions, and Elon Musk's visible leadership within Tesla operations. These developments, coupled with strong market sentiment during recent announcements, have further strengthened its medium-term outlook. External macroeconomic risks, however, may affect momentum, necessitating vigilance by traders.
Trading Recommendation:
The technical and fundamental setups for Tesla present an opportunity for traders to take long positions with clear upside targets in mind. Critical levels include the immediate support zone at $336.76 and a breakout above $354.25, which can further fuel Tesla’s bullish momentum. Traders should monitor macroeconomic conditions and company updates while maintaining vigilance on stop-loss levels to mitigate risk as market conditions evolve.

TSLA: Not recommended by me!Hello Traders,
TSLA Tesla fundamental score is not really good for me! My score is based on EPS data and EPS forecasts. there might be better stocks out there!
Regarding the technical aspects, White it reacted to the bottom of the channel median of the channel might be a small struggle. There is a strong possible resistance on the way up. I prefer to give a better/safer score after breaking this zone. Also, if we just consider technical analysis, any long options should have a SL, the possible rational SL is so far from the current price. in case of correction or breaking the zone, the possible SL could be very tighter.
Fundamental: Not recommended.
Technical: So-So.
Overall: I don't buy

Congestion Entrance TradingCongestion Entrance marks the transition from a trend to a period of uncertainty and range-bound price action.
📘 Key Concepts:
Congestion begins when price fails to close on one side of the PL Dot for 3 bars.
The first bar that closes on the opposite side of the PL Dot (after a trend) is the Congestion Entrance bar.
This signals a likely end of the previous trend and the beginning of congestion or reversal.
🧩 Key Structures:
Dotted Line: Highest high (or lowest low) of the previous trend — often acts as a cap or floor.
Block Level: Low (or high) of the Congestion Entrance bar — often attracts price and marks congestion boundaries.
Parameters of Congestion: The range defined by the Dotted Line and Block Level.
⚙️ How It Evolves:
There are multiple transition scenarios, for example:
Trend Up → Action → Trend Down: Resistance holds at the Dotted Line, Block Level breaks.
Trend Down → Action → Trend Up: Support holds at the Block Level, Dotted Line breaks.
Trend Up/Down → Reversal: Direct shift into opposite trend if support/resistance is firm enough — skipping action phase.
🔍 Key Takeaways:
Congestion Entrance is often the first clue the market is shifting gears.
It's essential to monitor how price reacts to the PL Dot, Dotted Line, and Block Level.
Anticipate Ping trades (quick scalps) or prep for potential Congestion Action if price fails to establish a trend after entrance.
📌 Pro Tip: Watch how higher timeframes align — if the HTP is showing signs of topping or bottoming, the LTP congestion entrance may lead into a reversal or major trend change.

TESLA: A Good Trade for Bulls AND BearsTesla has an Elon problem aka a SENTIMENT problem
I am a 100% Technical Trader
I am an avid believer in Elliott Wave Theory and Socionomics
From those perspectives its clear to me that Tesla is in trouble...long term
Tesla went from essentially a meme like stock to a media and Institutional darling
The meteoric rise in the stock was largely because of belief in Elon..the person
Yes his companies have done some pretty amazing things..but if we are honest there are tons of failed promises in their past and now we are seeing competitors start to really make ground
This is showing up in vehicle pricing and units delivered..both trending down
The problem Tesla stock truly has though is that soooooo much of the company sentiment is tied into a belief in Elon- the person..versus the fundamentals of the company and their actual products (cmon we all know LIDAR is better smh)
As his popularity wains... so will Tesla
So with that said the charts are setup to provide opportunities for BOTH BULLS and BEARS over the next few years.
The chart show really clean places to take and hedge positions... but long term BULLS need to be keely aware of the "Trouble" line because if and when it breaks Tesla will be in serious trouble
