$TSLA yieaahhhliterally a year ago on Feb 2024 I posted a beautiful chart that we nailed precisely.
Coincidence we meet again one year later? I hope yieahhhh
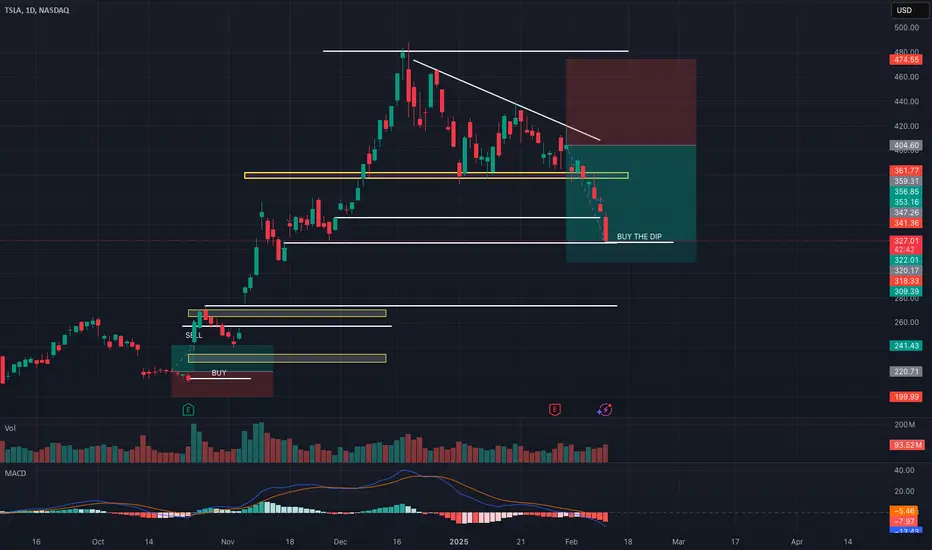
Strong confluences
1. 50% fib retracement
2. mid line on the parallel channel dating to stone age
3. RSI on weekly at 50
4. RSI on daily closed right at 30
Gamma exposure is heavy into the negative side - reason of the big selloffs vs other names that buy the dips - making this risky but I will stop right there, I only know how to draw lines.
IMO if this support doesn't hold, we might see 246 uff.
Yieaahhh
TL0 trade ideas

Tesla UpdateDamn it feels good to be right, lol. No in all seriousness, we knew this move lower was coming. I've been preaching about it for what, 2-3 weeks now. This pattern has appeared corrective for some time now, we just finally got the follow through over the last couple days. If this pattern is to proceed in a standard fashion, then we should get the microwave 4 & 5 next, followed by the sub-minuette wave iv & v. I imagine this will take a week or two to play out but as you well know by now, there is nothing that governs time. For now, I am watching the $300 area (+/- $10) for a possible bottom. This thing could easily extend lower though to the 1.382 or 1.618 @ $280.15 & $252.91 respectively.
Once we get towards the bottom of this pattern, I plan on taking a swing long to trade the (B) wave higher. I am expecting a roughly $100 swing at that point. I just sit here wondering what WILL cause that kind of a swing, not if. Don't get me wrong, that will be a b wave and they're historically complex. They don't always hit standard targets, but even if it only hits the area of the 0.382, that is still a $60-$70 swing. Now, these numbers I am mentioning right now are VERY rough estimates as we still don't even have a bottom formed. They're based on standard targets and are subject to change.
Once we get some more price action to play out, I will have more refined targets. For now, I am just waiting for the bottom to form so I can finally take another position in Tesla. As you know though, I am picky and very patient. If it doesn't pan out as expected, then so be it. I will have no qualms about missing out on a trade.

TSLA at a Critical Level! Reversal or Further Downside?Market Structure & Price Action:
* TSLA has been in a strong downtrend, breaking multiple support levels.
* It has rejected the descending trendline, continuing lower.
* Current price is hovering near $327, testing a key PUT support level.
🔍 Key Levels:
* Support:
* $327 – Strong PUT support (highest negative NETGEX).
* $295 – 2nd major CALL wall support.
* $250 – Long-term support if downside continues.
* Resistance:
* $360 – Heavy resistance from PUT wall.
* $380 – 3rd CALL wall resistance.
* $400 – Strong CALL resistance (37.69%).
📊 Indicator Analysis:
1️⃣ MACD:
* MACD is deep in negative territory, showing strong bearish momentum.
* A possible crossover could indicate a short-term relief bounce.
2️⃣ Stochastic RSI:
* Oversold conditions, indicating potential for a relief bounce.
* Needs confirmation with price action.
3️⃣ 9/21 EMA:
* TSLA is trading below both EMAs, confirming strong bearish structure.
* Needs to reclaim 9 EMA for any bullish reversal attempt.
🔥 GEX & Options Sentiment:
* PUT Support at $327: This is a critical level; a break below can accelerate selling.
* Call walls at $360 & $380: Resistance levels where buyers may struggle.
* IVR 51 / IVx 66.6: Moderate implied volatility, suggesting steady options activity.
🛠️ Trading Plan:
📉 Bearish Scenario (Break Below $327):
* If TSLA fails to hold $327, expect a drop towards $295.
* Ideal PUT entry: Break below $327 with volume.
* Stop Loss: Above $335.
* Profit Target: $300-$295.
📈 Bullish Reversal (Above $327):
* If TSLA reclaims 9 EMA & holds $327, expect a bounce towards $350-$360.
* Ideal CALL entry: Reclaim of $335 with strong volume.
* Stop Loss: Below $320.
* Profit Target: $350-$360.
🎯 Final Thoughts:
* TSLA is at a key decision point.
* A break below $327 triggers more downside.
* A bounce above $327 could offer a short-term relief rally.
🔔 Trade carefully & manage risk!
⚠️ This is not financial advice. Always do your own research before trading.

TSLA From Erection Come Correction UpdateSince my initial post, TSLA has lost usmuch as 24% of its total value.
Do not expect new highs anytime anytime soon. At best it will flip-flop at these levels for a while. Again this is the best case scenario.
Fundamentally TSLA is way overvalued. it is not even something anyone can debate rationally.
Despite the horrible fundies, I did offer a buy signal early on for a nice 40% gain plus based on technicals and Euphoria. Chaart below.

Tesla a buy opportunity?Tesla: An Opportunity?
Despite mixed results in several of its quarterly reports, there are several catalysts that could indicate that the recent price pullback might be a buying opportunity.
Revenue Growth: Tesla is expected to continue its revenue growth, driven by the expansion of its product portfolio and the adoption of its North American Charging Standard (NACS) by other automakers.
Innovations and Launches: Tesla plans to launch several new models in 2025, including a more affordable vehicle with a base price of around $25,000.
Challenges and Competition: Although Tesla remains a leader in the electric vehicle market, it faces increasing competition, especially from Chinese manufacturers.
Financial Outlook: Despite some uneven financial results in recent quarters, analysts remain optimistic about Tesla's long-term prospects. Revenue is expected to grow steadily, and gross margins are expected to stabilize as the company reduces costs.
Impact of AI: Tesla is investing in artificial intelligence technologies, which could further drive its growth and solidify its market position.
Bonus: Tesla is expected to launch its robotaxi service in Texas in June 2025 and the Optimus humanoids in 2026.

Tesla Battery Running Flat? Recharge Incoming at $300 Continuing from the previous Tesla breakdown, we can see price has respected the green zone, aligning with the previously called full-swing projection. As price approaches its high, it’s likely to face some retracement before the next significant move.
Key Levels to Watch:
- Point of Interest (POI): The Fair Value Gap (FVG) at the $300 zone presents a high-probability area for price to recharge and gather momentum.
- Next Upside Target: After the retracement, expect a push higher to retest the green zone and potentially make new highs.
Tesla’s price action remains dynamic, with opportunities for both retracements and breakouts. Always ensure proper risk management when navigating these setups.
Conclusion:
Short-term: Retracement to the $300 FVG zone.
Medium-term: Continuation upward targeting the green zone for new highs.
DYOR!

TSLA AccumulatingI'm a buyer here, nice sell side and Order Block that caused BoS, it has gas to move higher, if we head lower, ill look for entries at $242 Order Block/sweep.

TSLA, BUY THE DIP, right now, right here...We are filling the gap, right now.
If we go fill the second gap at 275, keep some money to DCA... ;)

Saying the quite things about TSLA out loud...This is my first chart art.
Hope you all find humor in the awful situation that is TSLA.
I do NOT see any situation where TSLA remains a Trillion Dollar market cap company for the next 4 years. Their cars are being sold used at historically higher volume, demand has gone down and their new model Y... WHY would someone buy that when the CEO and founder is sieg healing behind the podium the same day where the American Equivalent of the nuremberg laws are signed into law.
Behind the insanely bearish optics, the fundamentals have always been overvalued. TSLA is not a tech company. It's a car company built off the top of liberal ideology. It's founder is in an "open loop" or more accurately a "broke loop". He has chosen to support policy that harms his stock, such as removing the EV credit that has contributed to their profitability. Worse still, the acquisition of Twitter, using TSLA as collateral will inevitably result in a defaulted loan. Compounding still, further, he is borrowing money from new investors to fund xAI, which has no real value compared to OpenAI and is, itself being used to pay back the defaulting loans backed by TSLA.
This is a literal PONZI scheme, ran by someone who has put the entire fate of his company in the hands of a convicted fraudster with 7 bankruptcies under their belt.
It is a literal, red nazi flag.
Nothing NEO about it...

TeslaI wouldn’t be going long on Tesla at the moment.
Best to wait and see if we get an ABC correction sequence down to the next support level a shown.
If we do I see this as a great opportunity to go long.

Side/Down midterm then Up Long termI bought the first 140. Now in Amazon while the bagholders either waste price or time for this sideways period. You buying something at 400 and selling ten years later at 1600 are wasting the first 4 years in time. So yes, you are better then a nobody, but worse than a somebody.
Whatever floats your boat.
And btw, once this unfolds, I will be all in tesla again long term. Hail Elon. There is nobody even close to his level of genius.

How to Avoid Whipsaw price action at market openFutures are only reliable for how the US Stock Market will open. With the modern market structure whipsaw action after the market opens can cause huge losses or disappointing profits for retail day or swing traders. You will learn how volume oscillators can warn of a whipsaw or reversal day. Void of buyers is a crucial aspect of whipsaw to down trending stocks price action. Be aware of the End of Day Professionals only Auction and study end of day 1-3 minute data. Large lot pre market open trading begins about 3-4 hours before the US market opens. This is also crucial information. IF the pros are selling million share orders or setting up a sell short several million lot order, this will shift the sentiment to the downside even when there is a strong buy entry signal.

Tesla Short at 345🚨 Tesla Short at 345 🚨
Tesla hitting key resistance, and the structure looks weak. Targeting downside with a move into lower levels—ATR shows room for expansion. Watching for confirmation, but this setup looks clean!
#Tesla #TSLA #ShortTrade #DayTrading #Markets

Tesla Stock Rattled as Insiders Dump Shares. What’s Going On?EV maker’s sales in Europe have made a sharp U-turn this year with some regions selling half the volumes from a year ago. Is Musk’s political ambition causing car buyers to look elsewhere for electric wheels?
Tesla stock TSLA is off to a bumpy start of the year with 10% shaved off its market valuation since the first trading bell of 2025. It’s all likely tied to Elon Musk’s shifting focus from his electric-car giant and into US politics (and, some would say, beyond that and into European affairs).
To make matters worse, key insiders and directors dumped tons of shares this month, cashing out cold hard dollars. Elon Musk’s brother, Kimbal Musk, who’s a Tesla board member, together with two other key figures, Robyn Denholm and chief financial officer Vaibhav Taneja, sold roughly 200,000 shares.
Kimbal Musk offloaded 75,000 shares worth $27.6 million on February 6. Before that, on February 3, Denholm sold 112,390 shares worth more than $43 million. On the same day, Taneja parted ways with 7,000 shares worth $2.8 million.
The share sale is happening at a time when it’s getting increasingly difficult for Tesla to keep its brand equity out of Elon Musk’s public image. In January, Musk was making headline after headline on the politics pages of big media outlets.
His efforts to reshape the White House administration spilled over into interfering with UK politics (where he attacked UK Prime Minister Keir Starmer over his alleged involvement with “mass rapes in exchange for votes” ).
The Tesla CEO also hosted a discussion on X with Germany’s far-right candidate Alice Weidel. It happened about a month before Germany’s federal election on February 23. The live event pulled in roughly 100,000 streamers and sparked a debate over whether it was right to give a free platform to a far-right political party of a foreign country. There’s also Musk’s gesture likened to a Nazi salute he pulled off at Trump’s inauguration — that one really turned heads globally.
Enough politics, let’s dive into the numbers.
Tesla sales were shockingly bad in January. All around Europe, car buyers opted for cheaper Chinese alternatives in a sea of looming competition in the auto industry .
In the UK, sales dipped about 8% from last year’s January. Chinese EV maker BYD BYD saw a massive jump by 550% to 1,614 cars sold. In Germany, sales of Tesla vehicles dropped 60%, while BYD sales rose 69%. France logged a 63% decline in sales of Tesla while Spain saw the steepest drop of 75%. Norway registered a 38% drop in Tesla sales while Tesla’s market in Sweden shrunk 44%. In China, where Tesla commands a towering presence, sales were down 11.5% in the first month of 2025.
Moving outside Europe and across the Atlantic — California marked a decline in Tesla sales to the tune of 11.6%. It was the only carmaker with tumbling sales in the state.
"All of the decrease in the state market last year was attributable to Tesla, which had an 11.6 percent decline," the California New Car Dealers Association said. "Registrations for all other brands increased 1.4 percent."
By the looks of it, Tesla isn’t in a good place fundamentally and shares are down 28% from their record high in December. It’s also coming from a pretty battering fourth quarter where profits plunged 71% while sales barely made it above the flatline with a 2% growth year over year.
Do you believe Tesla’s fortunes are tied to Elon Musk’s ventures into politics? And if you had to choose, are you long or short Tesla? Share your thoughts below!

We're going down doooown!In an earlier round, and sugar we're going down swingin'!
Saw this triangle setting up and opened a short at $387 after seeing Elon's antics.
We may see a surge back up to complete the pattern, good luck!
Three point plan:
1. Descending Triangle Pattern breaks downward, target ~$270s
2. Fibonacci level at $270s
3. Strong resistance at ~$270s will turn to support
